Mar 04, 2026

Business is evolving fast. We, as engineers, build features we expect to improve business performance, but their actual impact is uncertain until measured. This is where experimentation comes in.
The key points of experimentation are:
If you develop software applications, you will likely have heard about A/B testing, which measures the impact of a change by comparing the performance of two versions of your application.
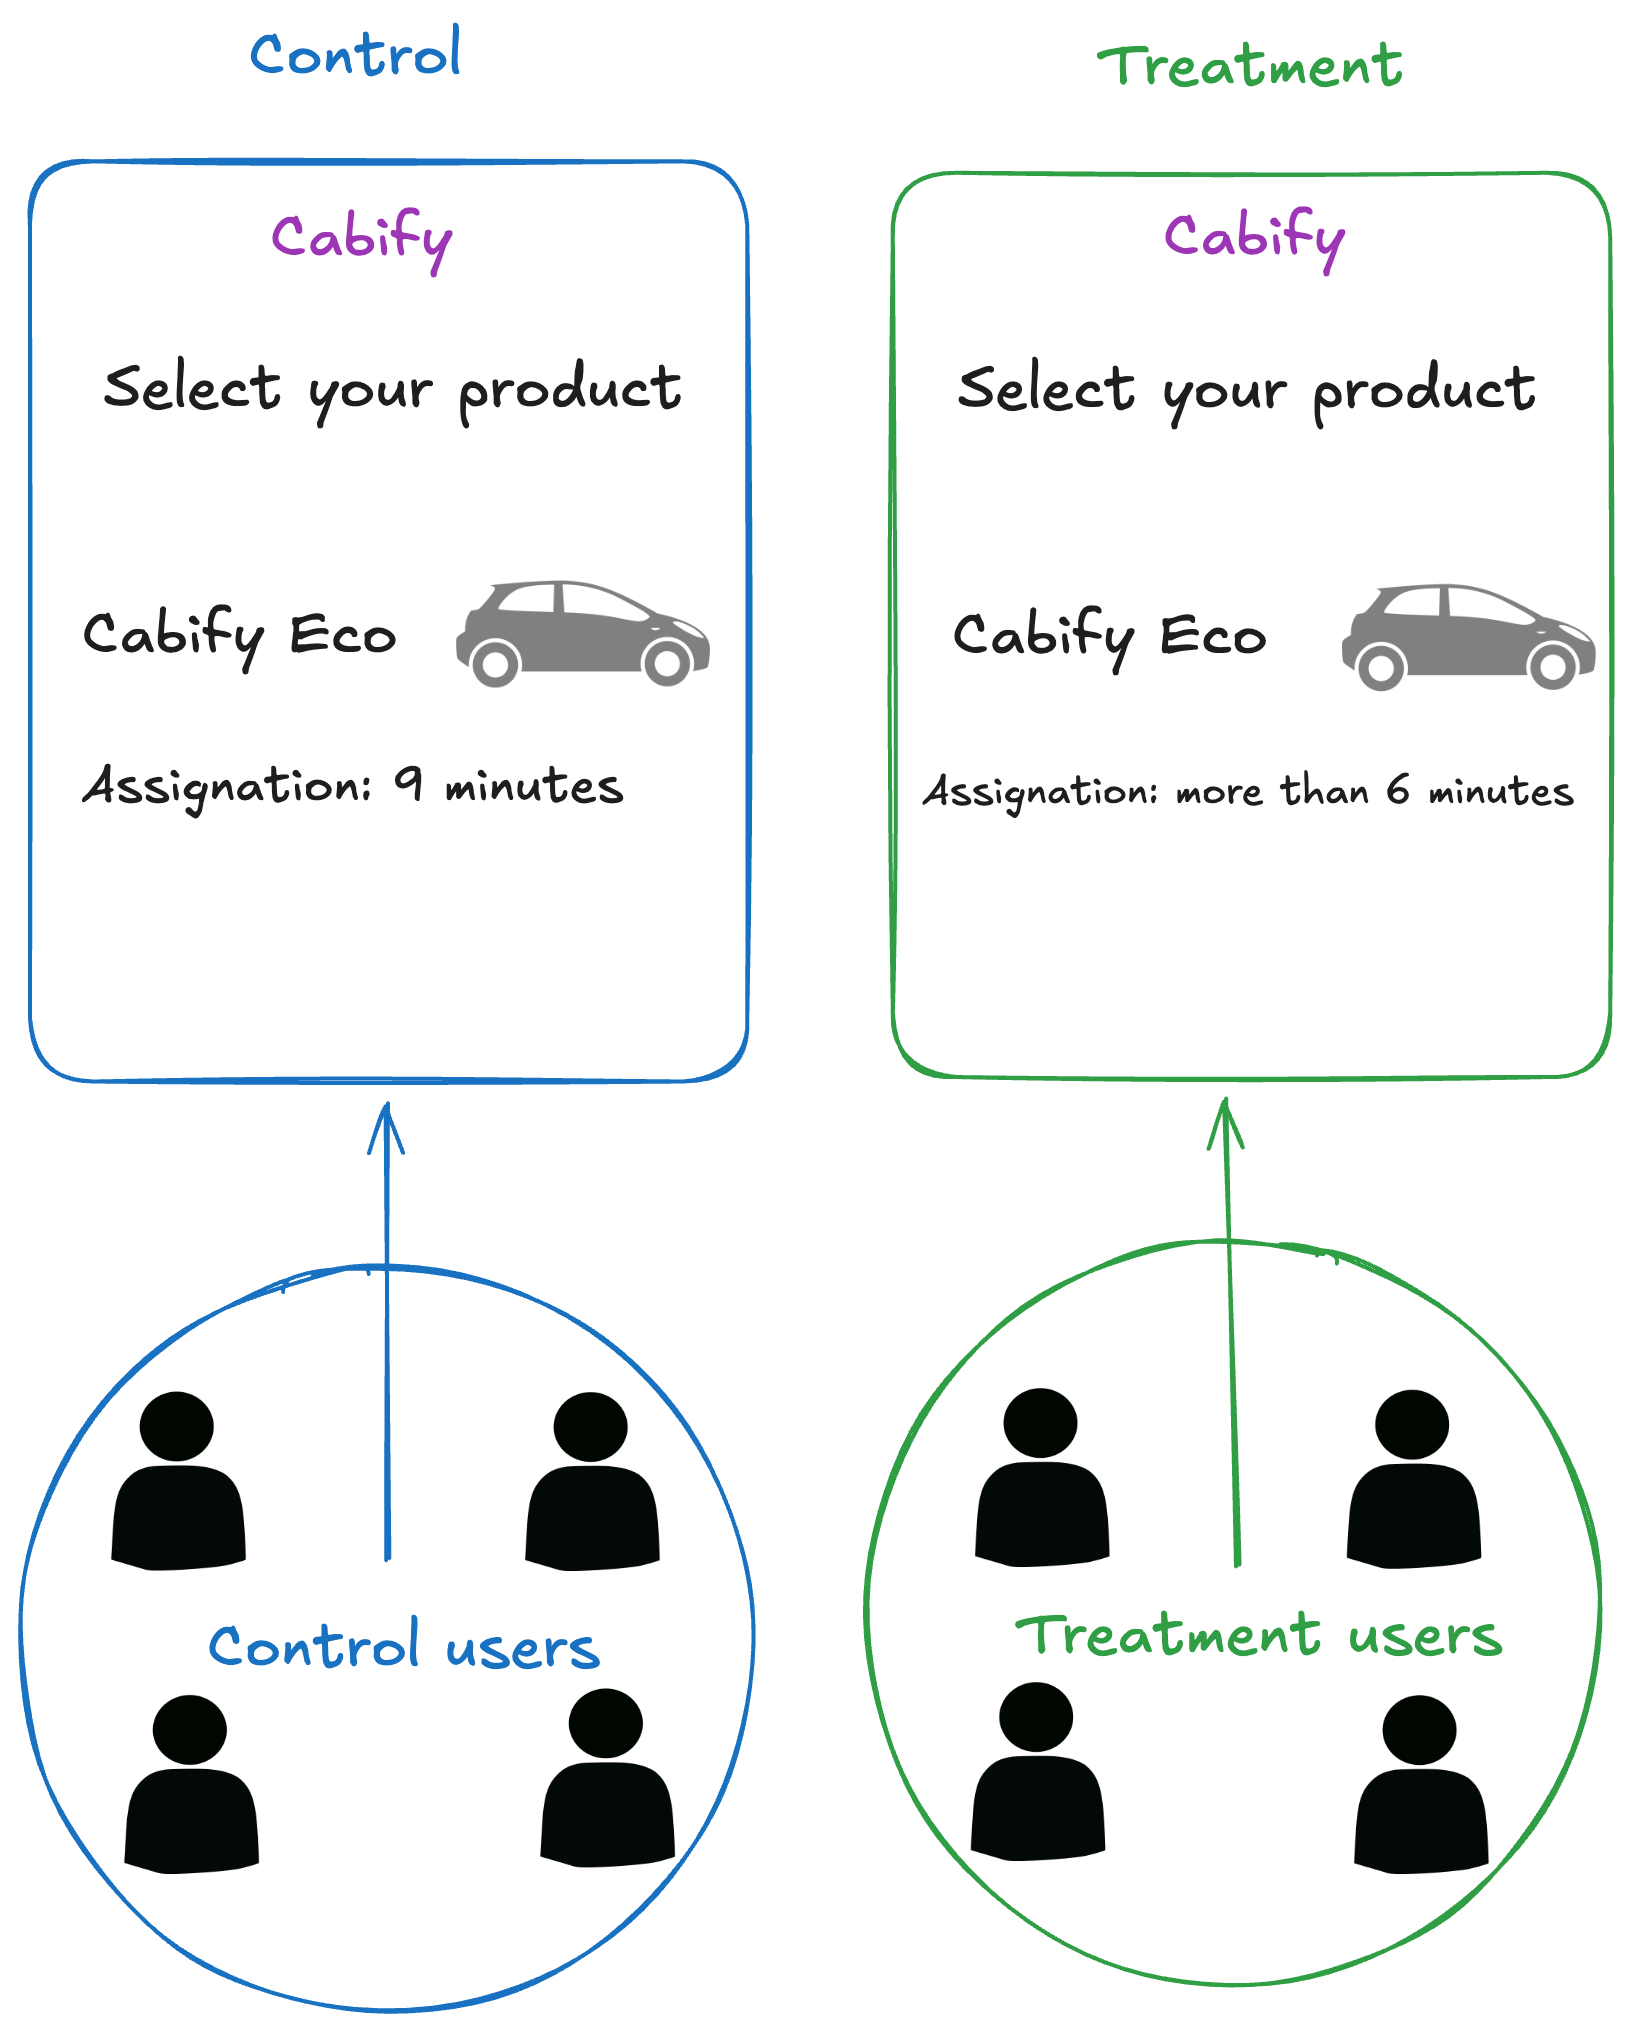
At Cabify, we run A/B experiments regularly. In the example shown below, users see different messages before ordering a journey. Those in the treatment group see a message like more than 6 minutes when the estimated wait time exceeds that threshold. The control group sees the standard message.
The target metric here was the conversion rate. We wanted to check how much the ETA affected the user’s decision to request a journey. So we measured and compared the conversions of both groups.
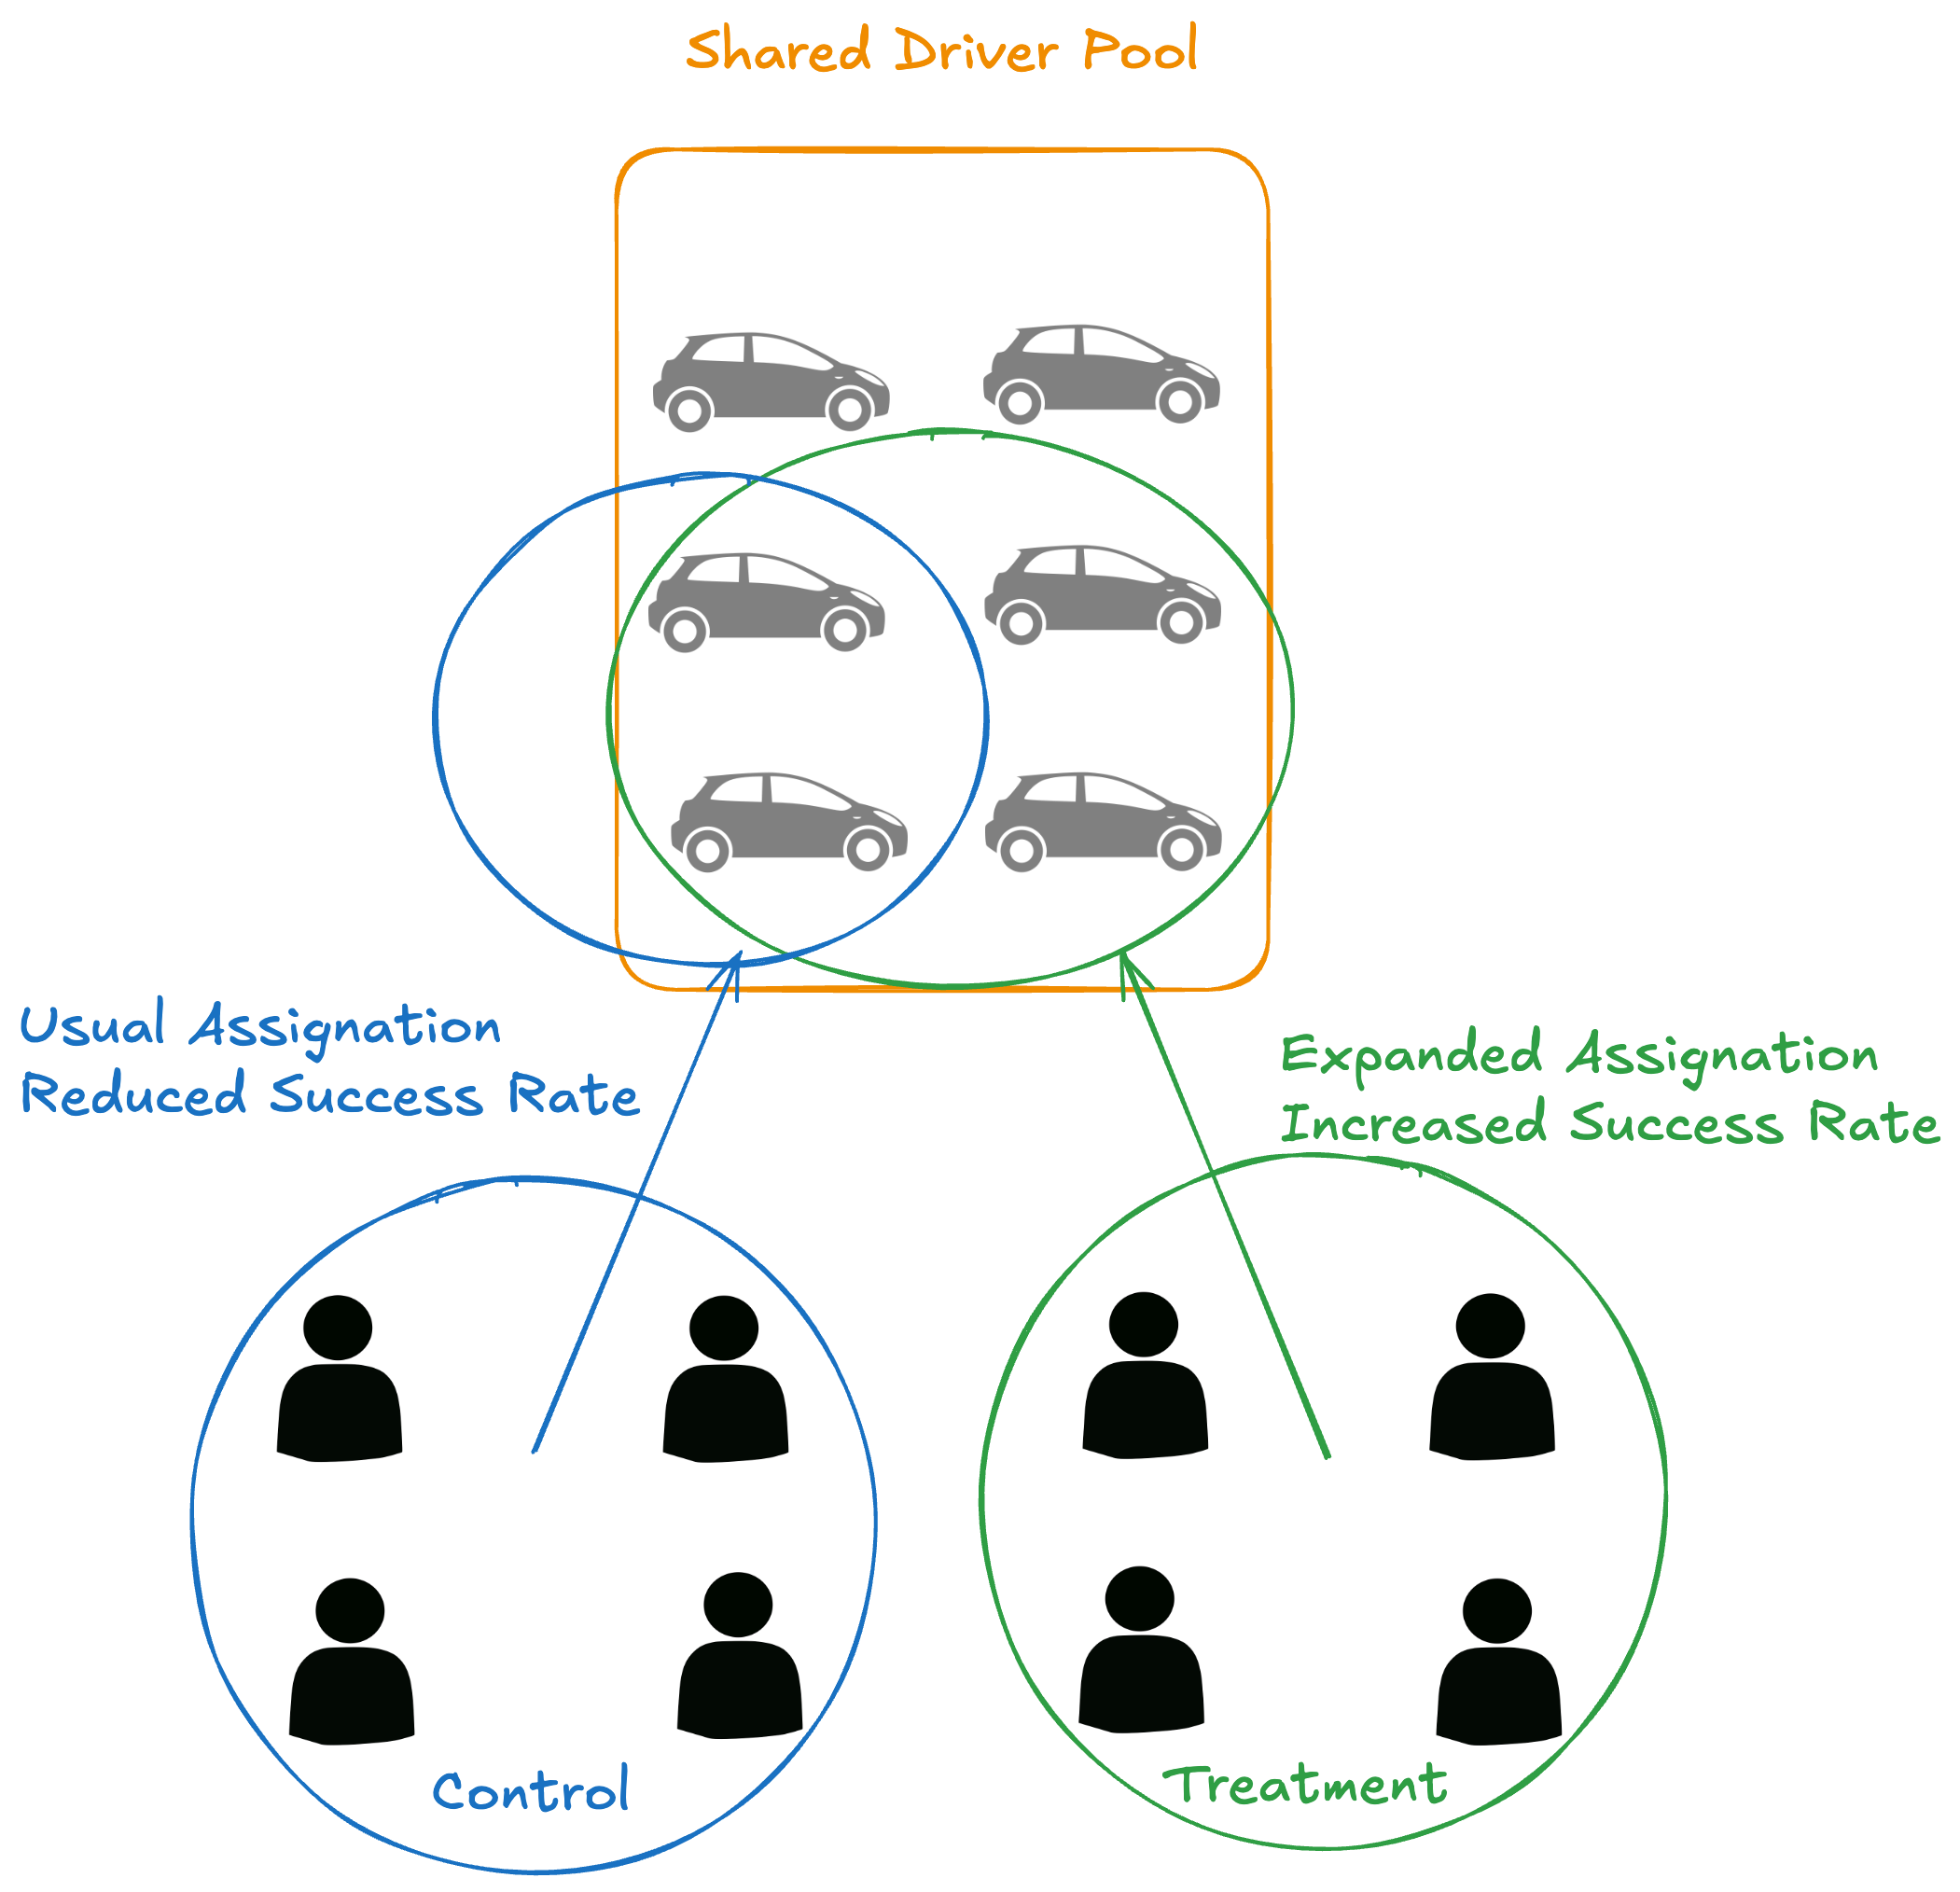
Although A/B testing is a powerful tool and something of a standard in the industry, there are situations where its limitations make it a bad choice. Notice that showing the ETA threshold to the treatment group does not affect the control group. Both groups are independent. What if we want to measure the impact on journey success rate (the percentage of journeys that complete successfully)? Journey success rate is a marketplace-level metric: it is affected by all users, not just those in one group. A higher conversion in the treatment group means more journeys created, which saturates the fleet and reduces supply for the control group, making their journeys less likely to complete. This cross-group interference is called cannibalization, and it makes A/B testing misleading for this type of metric. Switchback experimentation solves this issue.
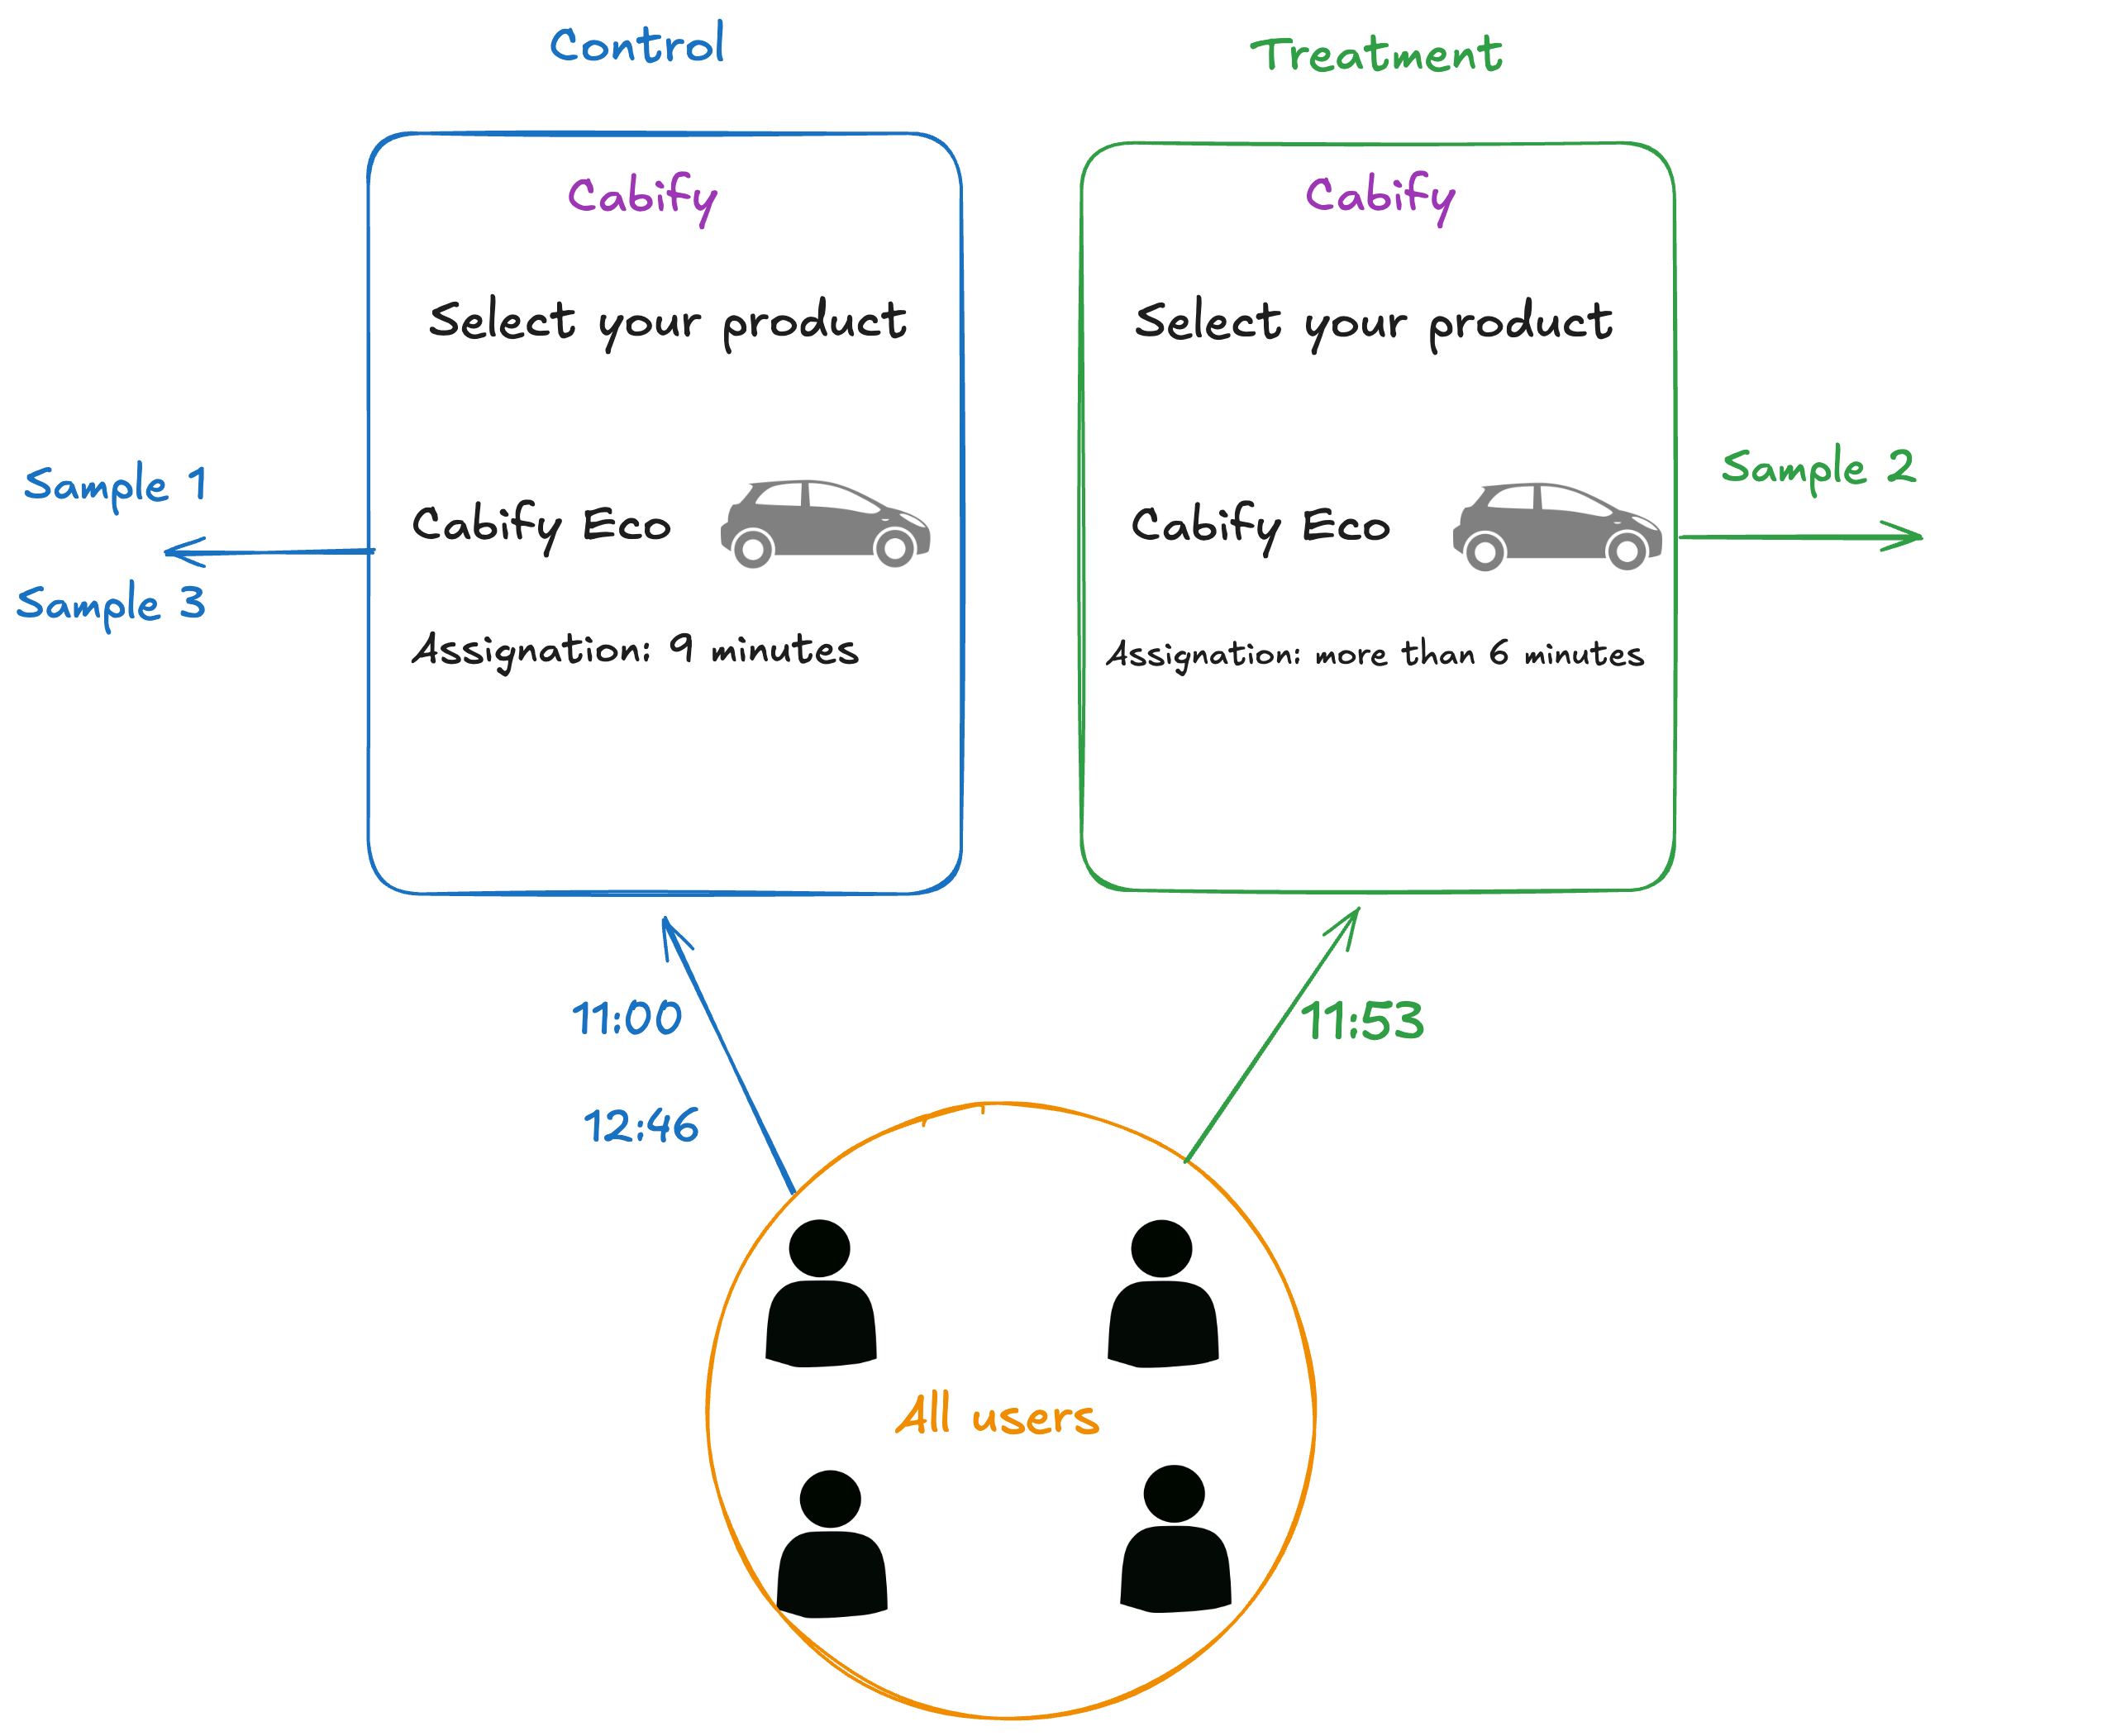
As its name suggests, a switchback experiment constantly switches all users between the two versions of the application. Unlike A/B testing, where group membership is fixed per user, here the group is determined by the time of the interaction, so a user may experience both versions over the course of the experiment.
Let’s go back to our example, this time using a switchback design, as illustrated below. We will define the group time interval as 53 minutes (a prime number, chosen to avoid cycling effects, as we will explain later). Once we deploy the feature, we will serve the treatment version of the application to all our users for 53 minutes. Then, we will serve the control version for 53 minutes. And so on. We can measure the performance during each interval for the whole experiment duration. Afterward, we will compare the performance of the two groups.
This way, both groups remain independent because we are randomly taking snapshots of the marketplace. With some adjustments in the analysis and the experiment definition, which we will explain later, we are able to measure the impact on marketplace metrics.
Although it might seem that the switchback experiment is a silver bullet, there are scenarios where it is not the best option. The obvious question is: should I use it for every experiment? The answer is no.
Take a look at the following table you can use to decide which type of experiment to use.
| Question | Switchback | A/B |
|---|---|---|
| Are all users affected by the feature? | Yes, creating dependency | No, it can be isolated |
| Is the main metric at user-level or it is a global one? | Global metric for all user groups | Local metrics tied to the user group |
| Is randomization possible without interferences? | No, control and treatment would cannibalize each other | Yes, we can randomly get isolated groups of samples |
So, the A/B test would be more effective to answer questions like “Do users who can directly check out make more orders?” On the other hand, switchback experiments are more effective to answer questions like “Is the marketplace more balanced when we assign the closest drivers to the riders?” or “What is the impact of applying a 10% price reduction for the regular ride-hailing product?”
Hence, the first thing to consider is which question you want to answer. Then, determine whether you can split users into independent groups.
If you find switchback experimentation a good fit for your experiment, there are some things you need to consider.
Like any other kind of experiment, switchback experiments need a minimum duration to get enough samples. Otherwise, we cannot measure precisely the performance of the two groups.
This is no different from A/B testing. The statistics beneath the decision to stop the experiment are the same. This is where the Minimum Detectable Effect (MDE) comes into play. Basically, the tinier the difference you want to notice, the more samples you need and the longer the experiment will last. MDE is the smallest change in your metric that your experiment can detect with statistical significance.
To determine the MDE, you need to understand your baseline metrics and your expectations on statistical significance. Then, you can calculate the MDE using a calculator like this one. Theoretically, you can determine the sample size you need. However, there are three main factors to consider when setting the experiment duration:
Lastly, take into account that, in switchback experiments, each interval is one sample, so you need longer experiments to get significant results.
The defining characteristic of switchback experiments is that group assignment is based on time: all users are assigned to the same group for a fixed interval before switching. Therefore, our next question is: how long should this interval be?
Again, there is no magical number to solve this question. That said, the very nature of time-based group switching introduces a complication we need to address.
In our ride-hailing example, imagine we want to test a feature that increases the number of drivers available for a rider. We expect this to have a positive impact on the total number of journeys performed. If we are in the last minutes of the treatment interval, and a rider starts a journey, it may end after the control interval began. The rider will be affected by the control version. Moreover, the journey drop-off will be finished during the control group interval. So, even if the drop-off was made due to the treatment change, it is counted as a control success.
This effect of early treatment affecting later outputs is called Carryover effect. It affects the switchback interval duration because the more persistent the effect, the less frequently you should switch intervals (Bojinov, Simchi-Levi, and Zhao 2023). This affects our measurements, which is why we apply washout periods to remove the effect of the early treatment.
The interval also needs to be long enough to capture the full lifecycle of the actions you want to measure. For journey-level metrics, that means covering typical assignment and completion times; for shorter signals like driver acceptance rates, a shorter interval suffices.
With all of this said, a good interval duration should:
Common choices are 58 minutes and 112 minutes. It is also common to use prime numbers like 53 minutes or 29 minutes, which work well to avoid those cycling effects. However, recent studies propose Poisson-distribution-based dynamical interval lengths to improve the accuracy of the analysis (Ruoxuan Xiong, Alex Chin and Sean J. Taylor, 2024).
Not every experiment fits the A/B model. When a feature affects all users at once and your key metrics operate at the marketplace level, group isolation is impossible, and A/B results will be misleading.
Switchback experimentation solves this by using time as the grouping dimension. It is a more complex tool though: interval length and experiment duration require deliberate planning, and the carryover effect needs to be accounted for in both the design and the analysis.
The decision is straightforward: if your metric is local to a user, use A/B. If it is global, consider switchback.

Software Engineer