Nov 26, 2025

Observability standards have traditionally been the province of backend services first, while frontend and mobile apps were isolated into their own walled gardens, with their own specialized tooling. The rise in popularity of the OpenTelemetry ecosystem during the last few years has given us a rare opportunity for unification across backend and frontend observability: one common library amongst all of our cabify apps on different platforms to send data in the exact same format that backend systems do.
Mobile Observability at Cabify has been a goal for a long time now. The need for it was made apparent after a few incidents where the mobile app and the backends it communicated with would disagree about expected response formats. These incidents typically manifested as sudden increases in app crashes or drops in business metrics, with no clear indication of what was happening within the mobile apps themselves.
During incident investigation, if we suspected a potential bug or unexpected behavior from mobile apps, we were forced to correlate generic numbers of app crashes or clear drops in business metrics with the backend services’ metrics. This indirect approach was necessary because our mobile apps were not reporting any modern observability signals to our existing observability stack - no logs, metrics, or traces that could help us pinpoint issues quickly.
Without direct visibility into the mobile app’s behavior, we couldn’t efficiently identify whether problems originated in the app, in the backend services, or in the communication between them, often having to guess or rely on third party bug reports and trying to reproduce the issue manually. Needless to say, this diagnostic gap often resulted in longer resolution times and increased impact on our users.
The need for mobile observability was spotted by some mobile teams, a few years before we ever set our eyes on a cohesive solution. Those first early attempts were based on sending metrics directly from the apps (in Prometheus text format) to a gateway based on prom-aggregator-gateway.

These efforts were successful in establishing a basic level of observability (ie: we managed to successfully ingest and query a few metrics received from apps themselves), but suffered from some shortcomings:
Limited implementation scope - Implementation was inconsistent across our mobile ecosystem: some of our apps implemented this solution, while others simply did not. We lacked a coordinated effort to implement the same observability solution across all apps. At this point we were content with having any observability at all in the apps, so any improvement (even if it wasn’t universal) was seen as a positive development, and onboarding to it was left as an optional improvement, to be implemented (or not) at the discretion of the teams involved.
Inability to horizontally scale aggregators - We quickly found out that we could not horizontally scale the metric aggregators in our setup at all. Metric pushes could land on any aggregator, which made it impossible to shard them in any way. This led to frequent memory exhaustion issues and degraded performance (ie: progressively slower scrape times, pod restarts).
It was clear that we needed another solution, or at least a way to address the shortcomings of the existing one, but it was unclear at the time how to proceed without costly investments on custom tooling. Our investigations led us to some commercial offerings, but we always prefer as a rule to try to build our own solutions if they’re based con open source tools, are cost-effective and maintainable. Our engineering culture has traditionally favored building over buying, unless the maintenance tradeoff clearly doesn’t make sense. Even so, we really didn’t find a solution that checked all the boxes until…
Before diving into the implementation details of the OpenTelemetry-based solution we arrived at, it’s important to understand why implementing consistent observability across mobile apps presents unique challenges compared to backend services.
Unlike backend systems, where we control deployment and can ensure all instances run the latest version, mobile apps are installed on user devices with update schedules relatively beyond our control. When we release a new version of our app with improved observability features, users may not update to it for a significant period of time. Different device types and OS versions may have different update patterns and we have to support multiple app versions simultaneously in production. That’s just the reality of mobile app development.
This versioning mismatch creates significant challenges for implementing consistent observability. Features implemented in newer app versions won’t be available in older ones still being actively used. Whatever design we came up with, it had to keep in mind these limitations in its design.
Adoption of OpenTelemetry at Cabify had started some time ago in our backend services: we had been pushing for a number of years an initiative to improve backend observability by adopting distributed tracing across the board. Internal framework libraries started offering tracing support on the standard HTTP/gRPC server and clients, database (mysql) clients, etc.
Our weapon of choice for forwarding metrics to our backend had become Grafana Alloy (and Grafana Agent before that), giving us some familiarity with the concept of ingestion pipelines (a concept directly taken from the OpenTelemetry Collector). We run a considerable chunk of the grafana stack in-house, but beyond that Alloy simply offers a very ergonomic wrapper to the vanilla opentelemetry collector.
It was in that context that the mobile teams saw an opportunity to coordinate a unified approach to observability across all apps and platforms. They had heard about OpenTelemetry as a possible unifying option for observability (internally from backend teams, and in general on the Internet, or on talks given by grafana itself at the Cabify offices) and were wondering if we could offer a way for mobile apps to have their observability data ingested in the same way that backend apps do (and not just traces: but logs and metrics too).
The ultimate goal was integration with backend services: to have traces with mobile app spans wrapping them up (since the mobile app initiates the requests to the services, it only makes sense), logs with crash information, and metrics that could be joined with existing backend service ones to find significant patterns during an outage or incident of any kind.
Reflecting on our pain points and the challenges with our initial attempts, we realized that we needed a solution that would:
OpenTelemetry seemed to perhaps be able to check all the boxes, but we needed to embark on a little investigation into how to implement it in detail. And so we did.
Our first idea was simple: seeing the problems we had with metric aggregation scaling, wouldn’t it be great if we could forego any kind of in-memory aggregation at all by a dedicated backend-like service like prometheus-aggregation-gateway and merely aggregate metrics at ingestion time, in the forwarders’ pipelines themselves? This way, we could get rid of the aggregator component entirely and solve one of our technical pain points: our inability to scale aggregation horizontally.
We quickly identified two processors that seemed worth investigating:
Unfortunately, our investigation didn’t yield the results we were hoping for, due to two key limitations:
interval processor does not accumulate delta metrics (it passes them to the next component undisturbed). We wanted mobile apps to send delta metrics as a hard requirement, so this approach wasn’t viable.transform operator via the aggregate_on_attributes function did not provide the ability to aggregate any metric on any label like prometheus-aggregation-gateway does: it required specifying in the configuration which metrics and labels it was supposed to act on, and what the result would be exactly. We realized it was clearly not designed to be a generic metric aggregator and adopting it for the purpose of metric aggregation would require us to adopt a costly process on metric/label addition or change: we’d need to update the forwarder configuration each time a new metric or labels was introduced. This was a really undesirable situation: we were not ready to give up the ability to freely modify our metrics or labels without any changes to our ingestion setup at all.After our pipeline-based aggregation approach came up short on delivering the requirements we needed, we considered simply attempting to eliminate any in-memory aggregation entirely and just ingest all the raw mobile app metrics. This would be a tradeoff: more ingestion load (obviously: foregoing in-memory aggregation would multiply the ingestions), in exchange for not having to build and maintain any custom aggregation solution.
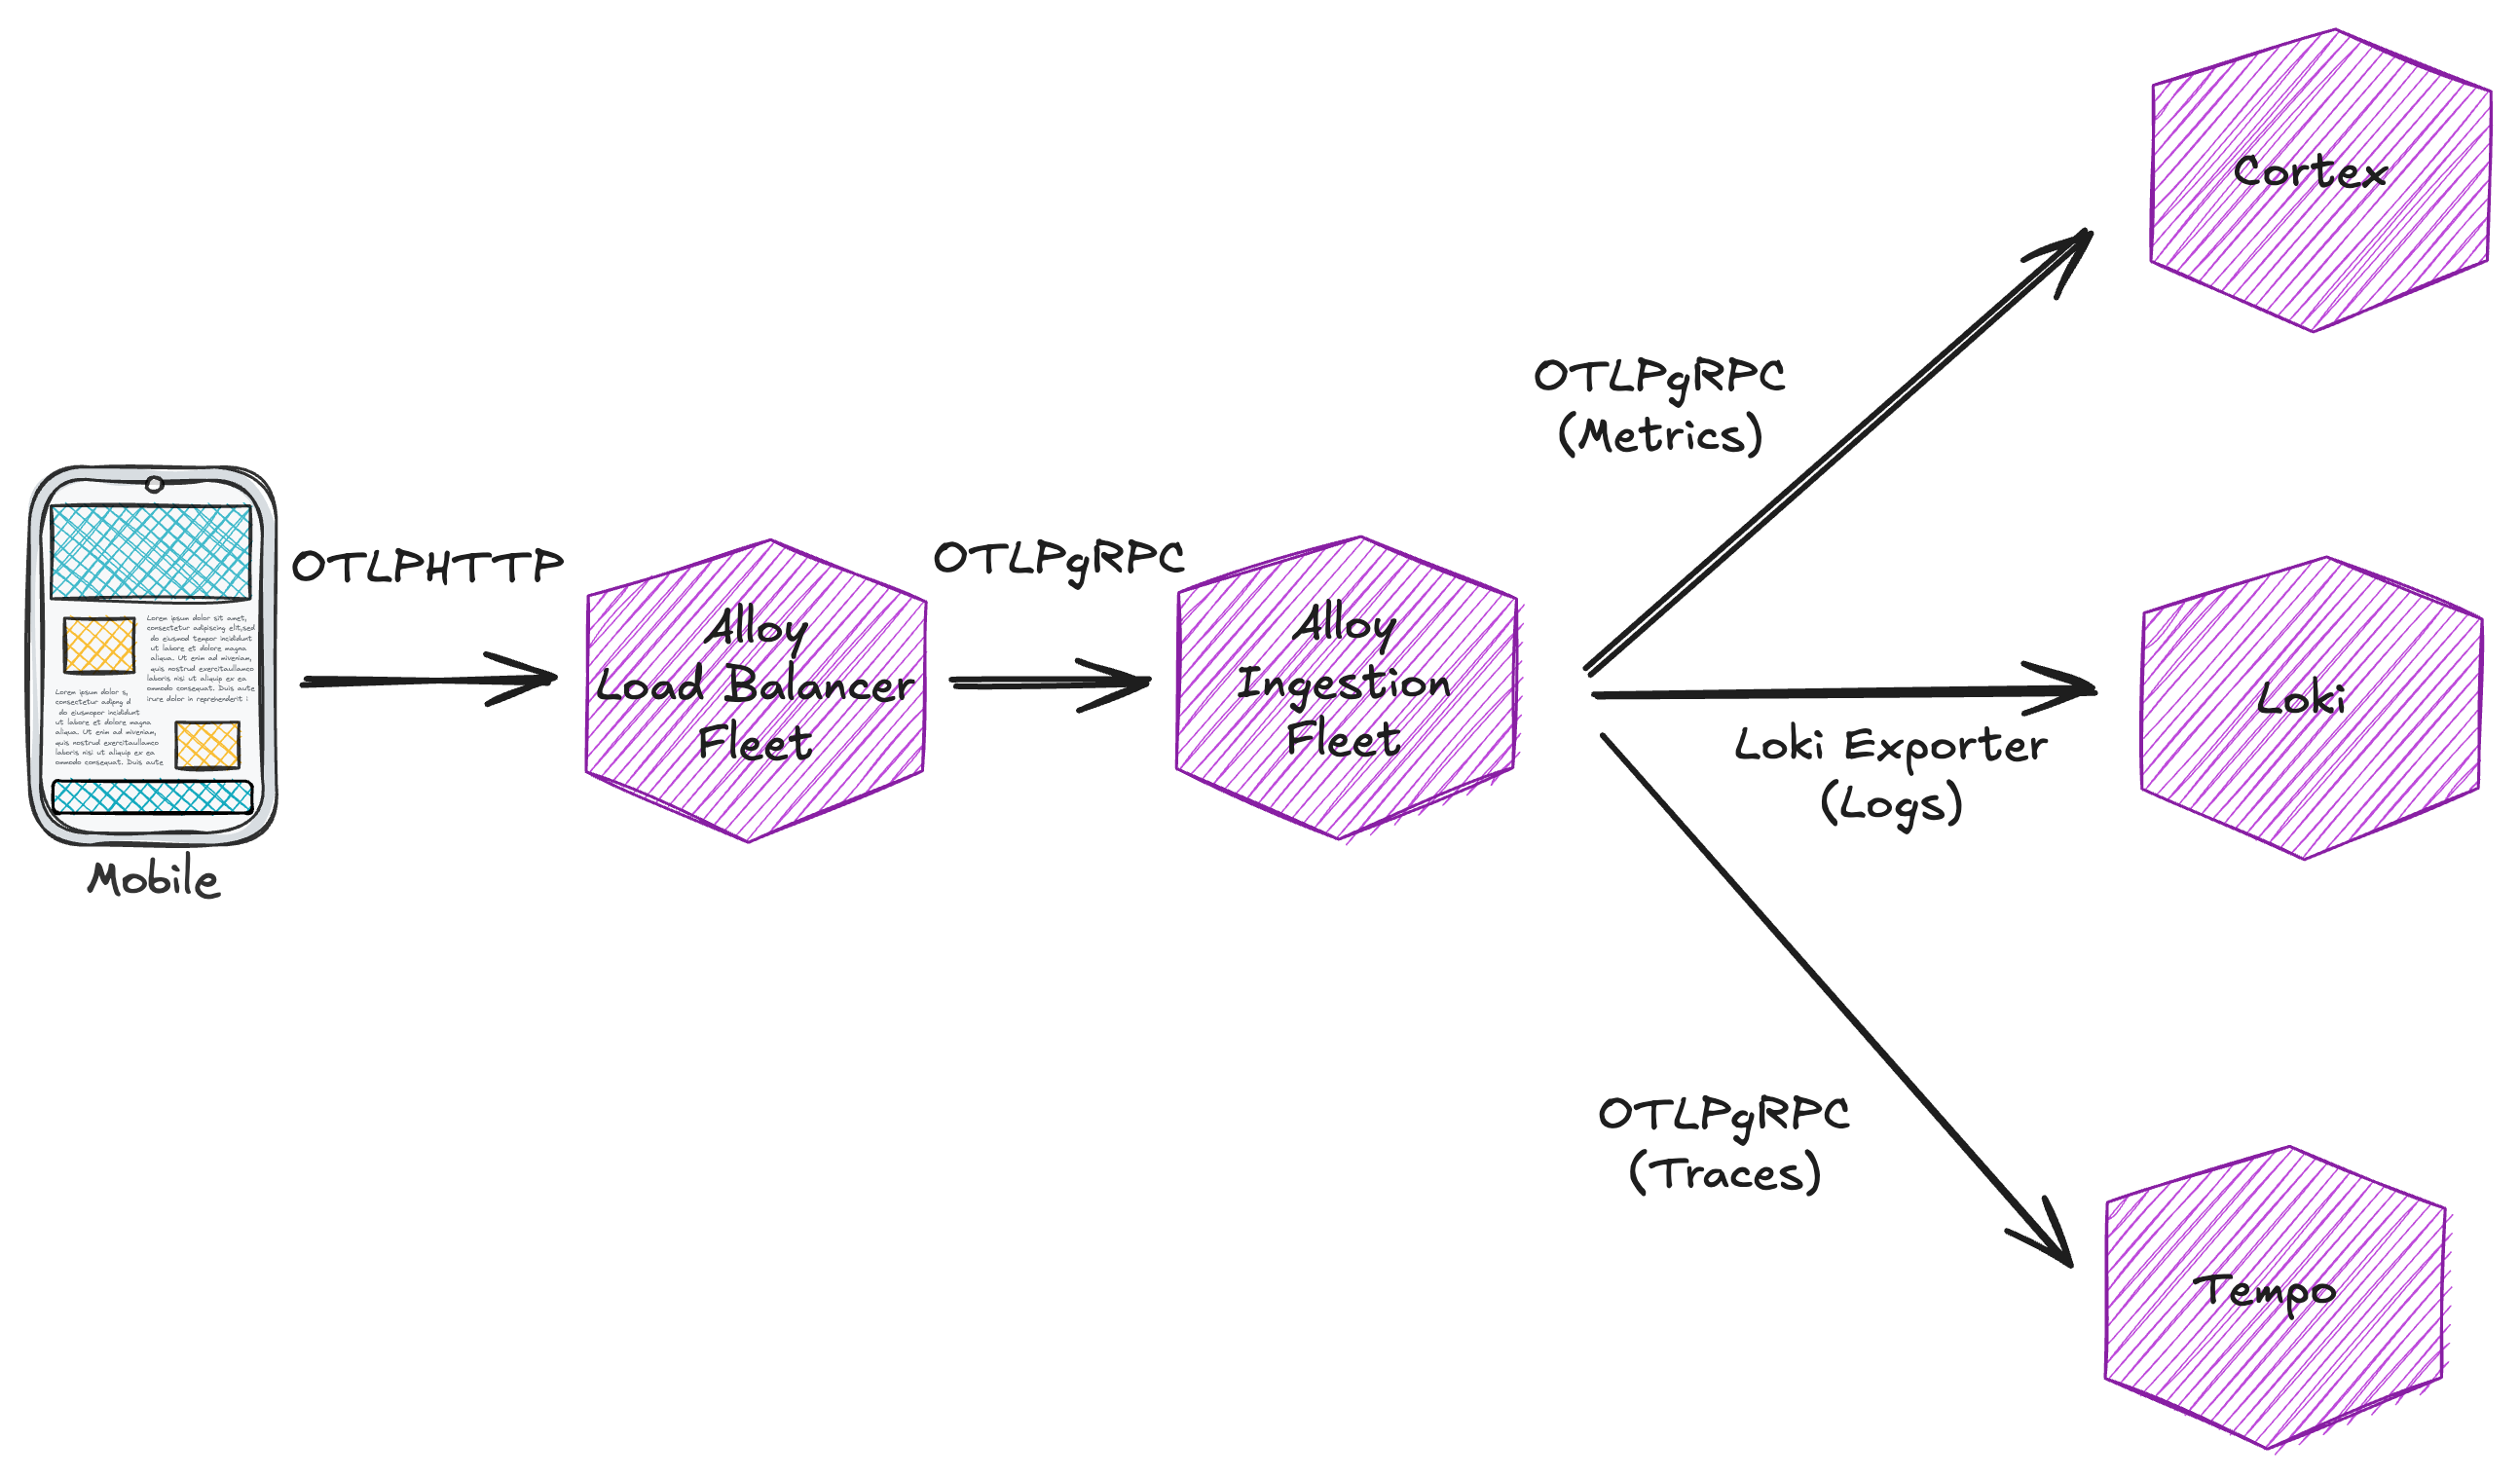
We maintain an in-house cortex cluster in-house, so we decided to test this approach with a small percentage of production traffic. Unfortunately, our experiment quickly confirmed that aggregation was not optional after all. Even with minimal adoption (that is: enabling only a small percentage of mobile app users sending telemetry), we started seeing ingestion throttling on the metric forwarders (in the form of 429 rejections of metric batches).

This was actually a positive development in one sense: it confirmed our backend was correctly enforcing the rate limits we had configured. We briefly considered the possibility of just scaling up our infrastructure to handle the load, but that would mean brute forcing a solution. It became clear we’d have to find a way to aggregate in-memory after all: we had tangible proof that with our workload it was absolutely necessary.
The core insight of in-memory metric aggregation was that we could greatly reduce ingestion load by aggregating the metrics in memory before sending to our metrics storage - converting a constant torrent of small updates into periodic batched updates. In a way, creating a “virtual” backend service where the mobile metrics reside, which can be scraped like any other.
Our metrics had characteristics that made them ideal candidates for aggregation: there were not many of them, the cardinality for the labels was limited (or so we believed, more on that later) and so were the labels themselves. Plus, since they’d be brand new, we had a chance to standarize them across different apps and platforms.
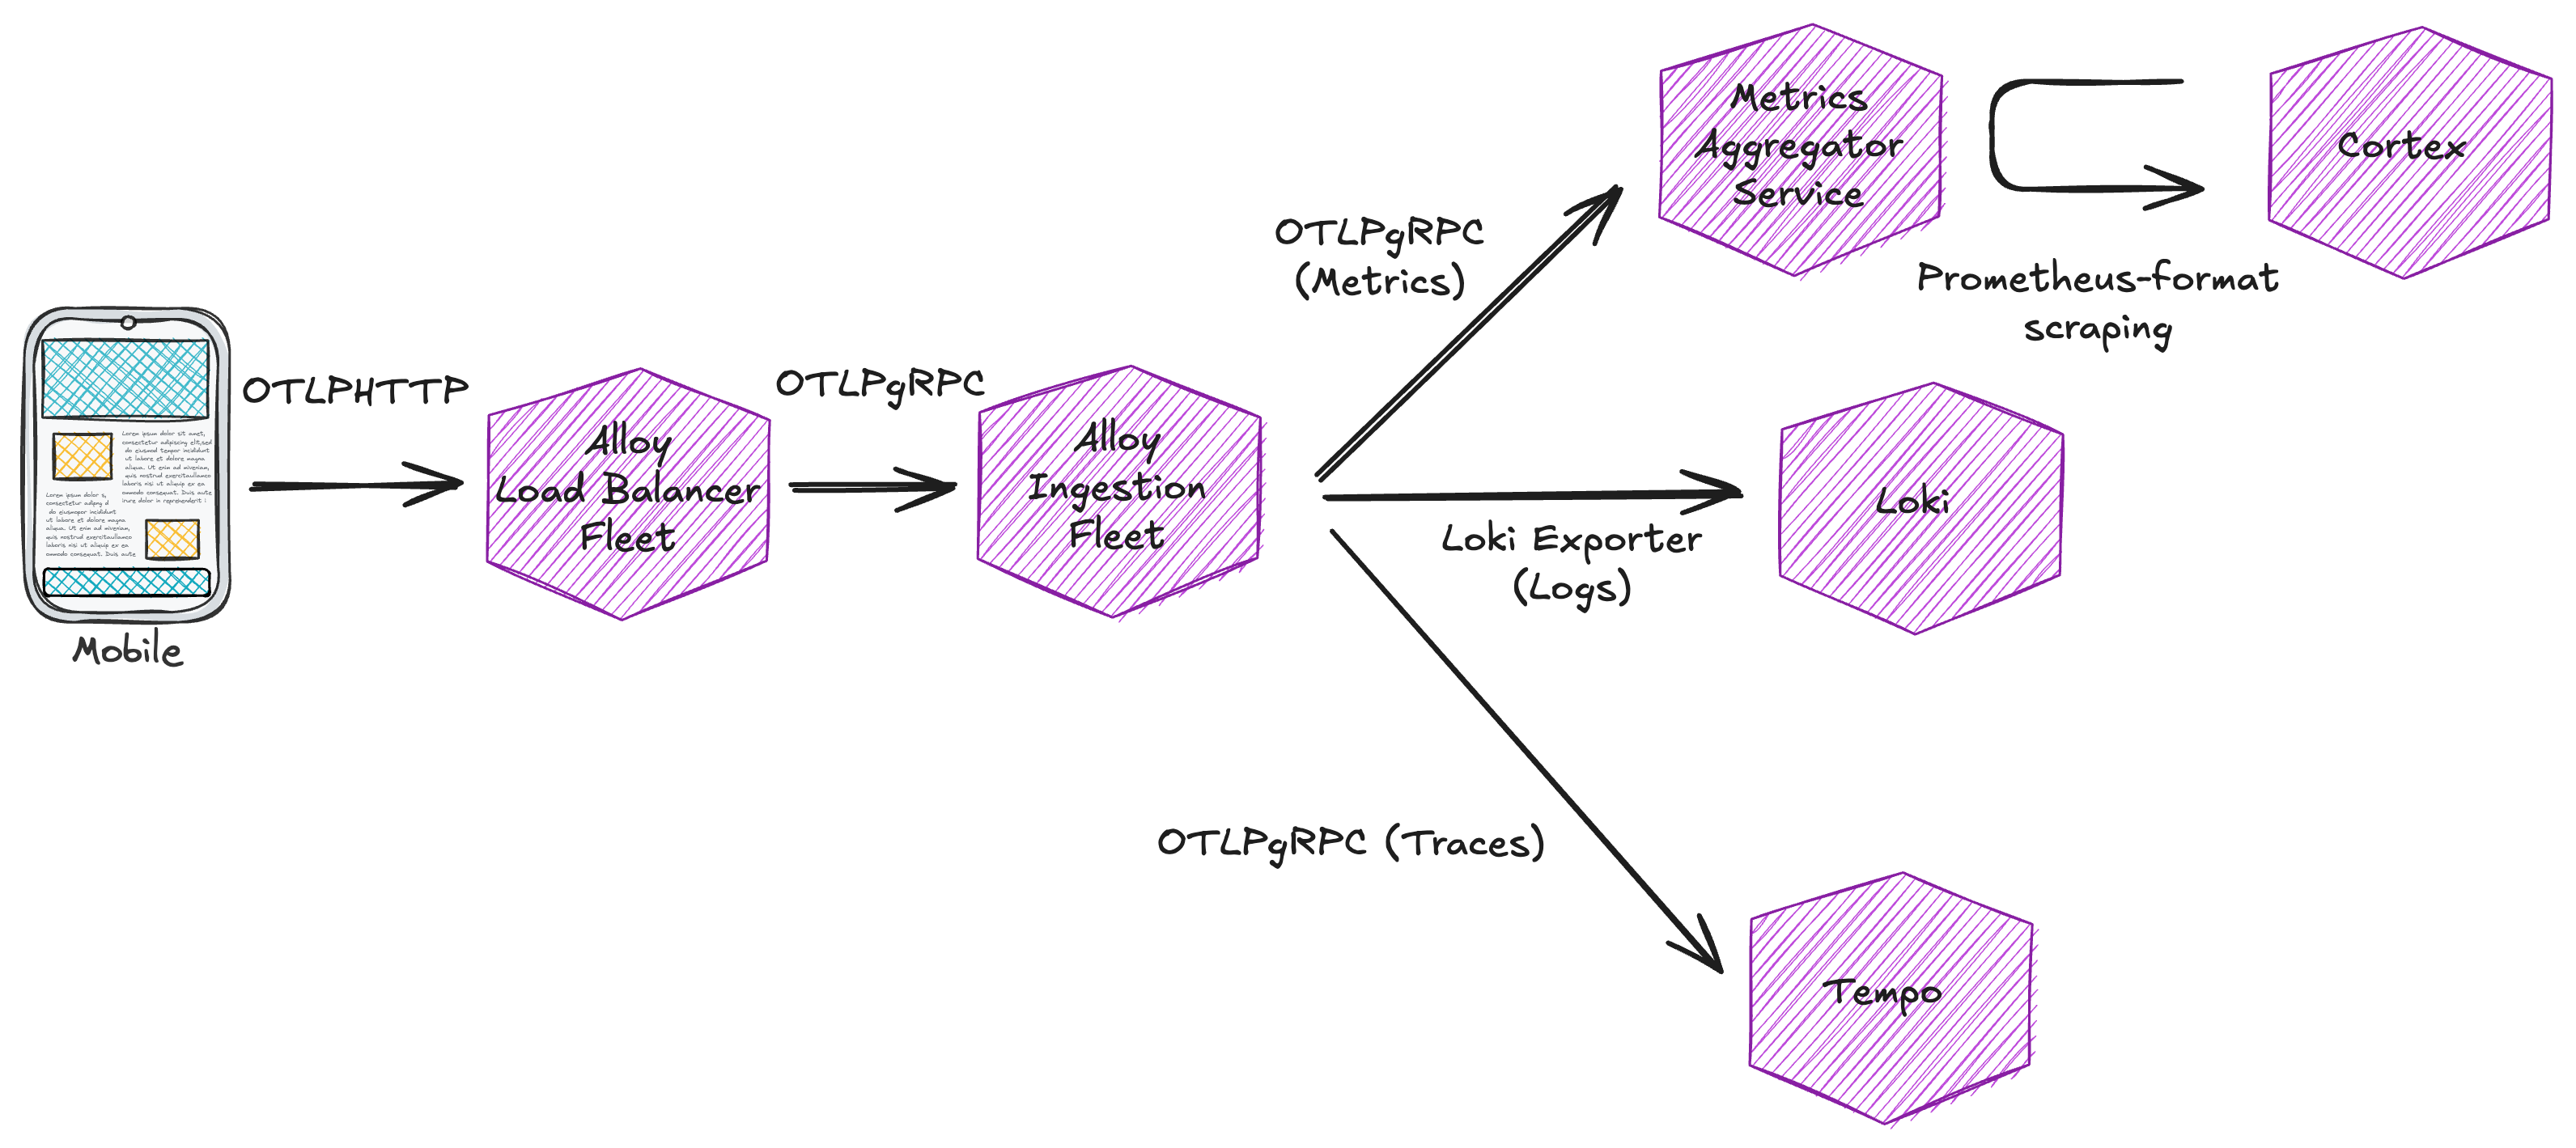
There was just one little technical problem: while we could reuse concepts from the backend of our previous aggregator, we would definitely need an entirely new frontend that could ingest metrics in OpenTelemetry format rather than Prometheus text format!
Our first attempt used a Prometheus remote write-based frontend. We knew we could translate OpenTelemetry metrics to that format since Grafana Alloy includes an exporter for it. Unfortunately, this approach failed because the Prometheus remote write exporter didn’t (at the time) implement v2 of said protocol, which proved to be a hard requirement to obtain the metric metadata needed to recreate metrics in prometheus text format, so they could be scraped and sent to cortex.
We pivoted again and implemented a new frontend compatible with OpenTelemetry metrics in gRPC format, translated them to OpenTelemetry pipeline data structures (the standard otel data structures used for in-memory manipulation), and finally converted them to prometheus MetricFamilies (a format that allows easy aggregation and translation to prometheus metrics text format). This new frontend required some comprehensive test coverage to ensure correct aggregation at each step.
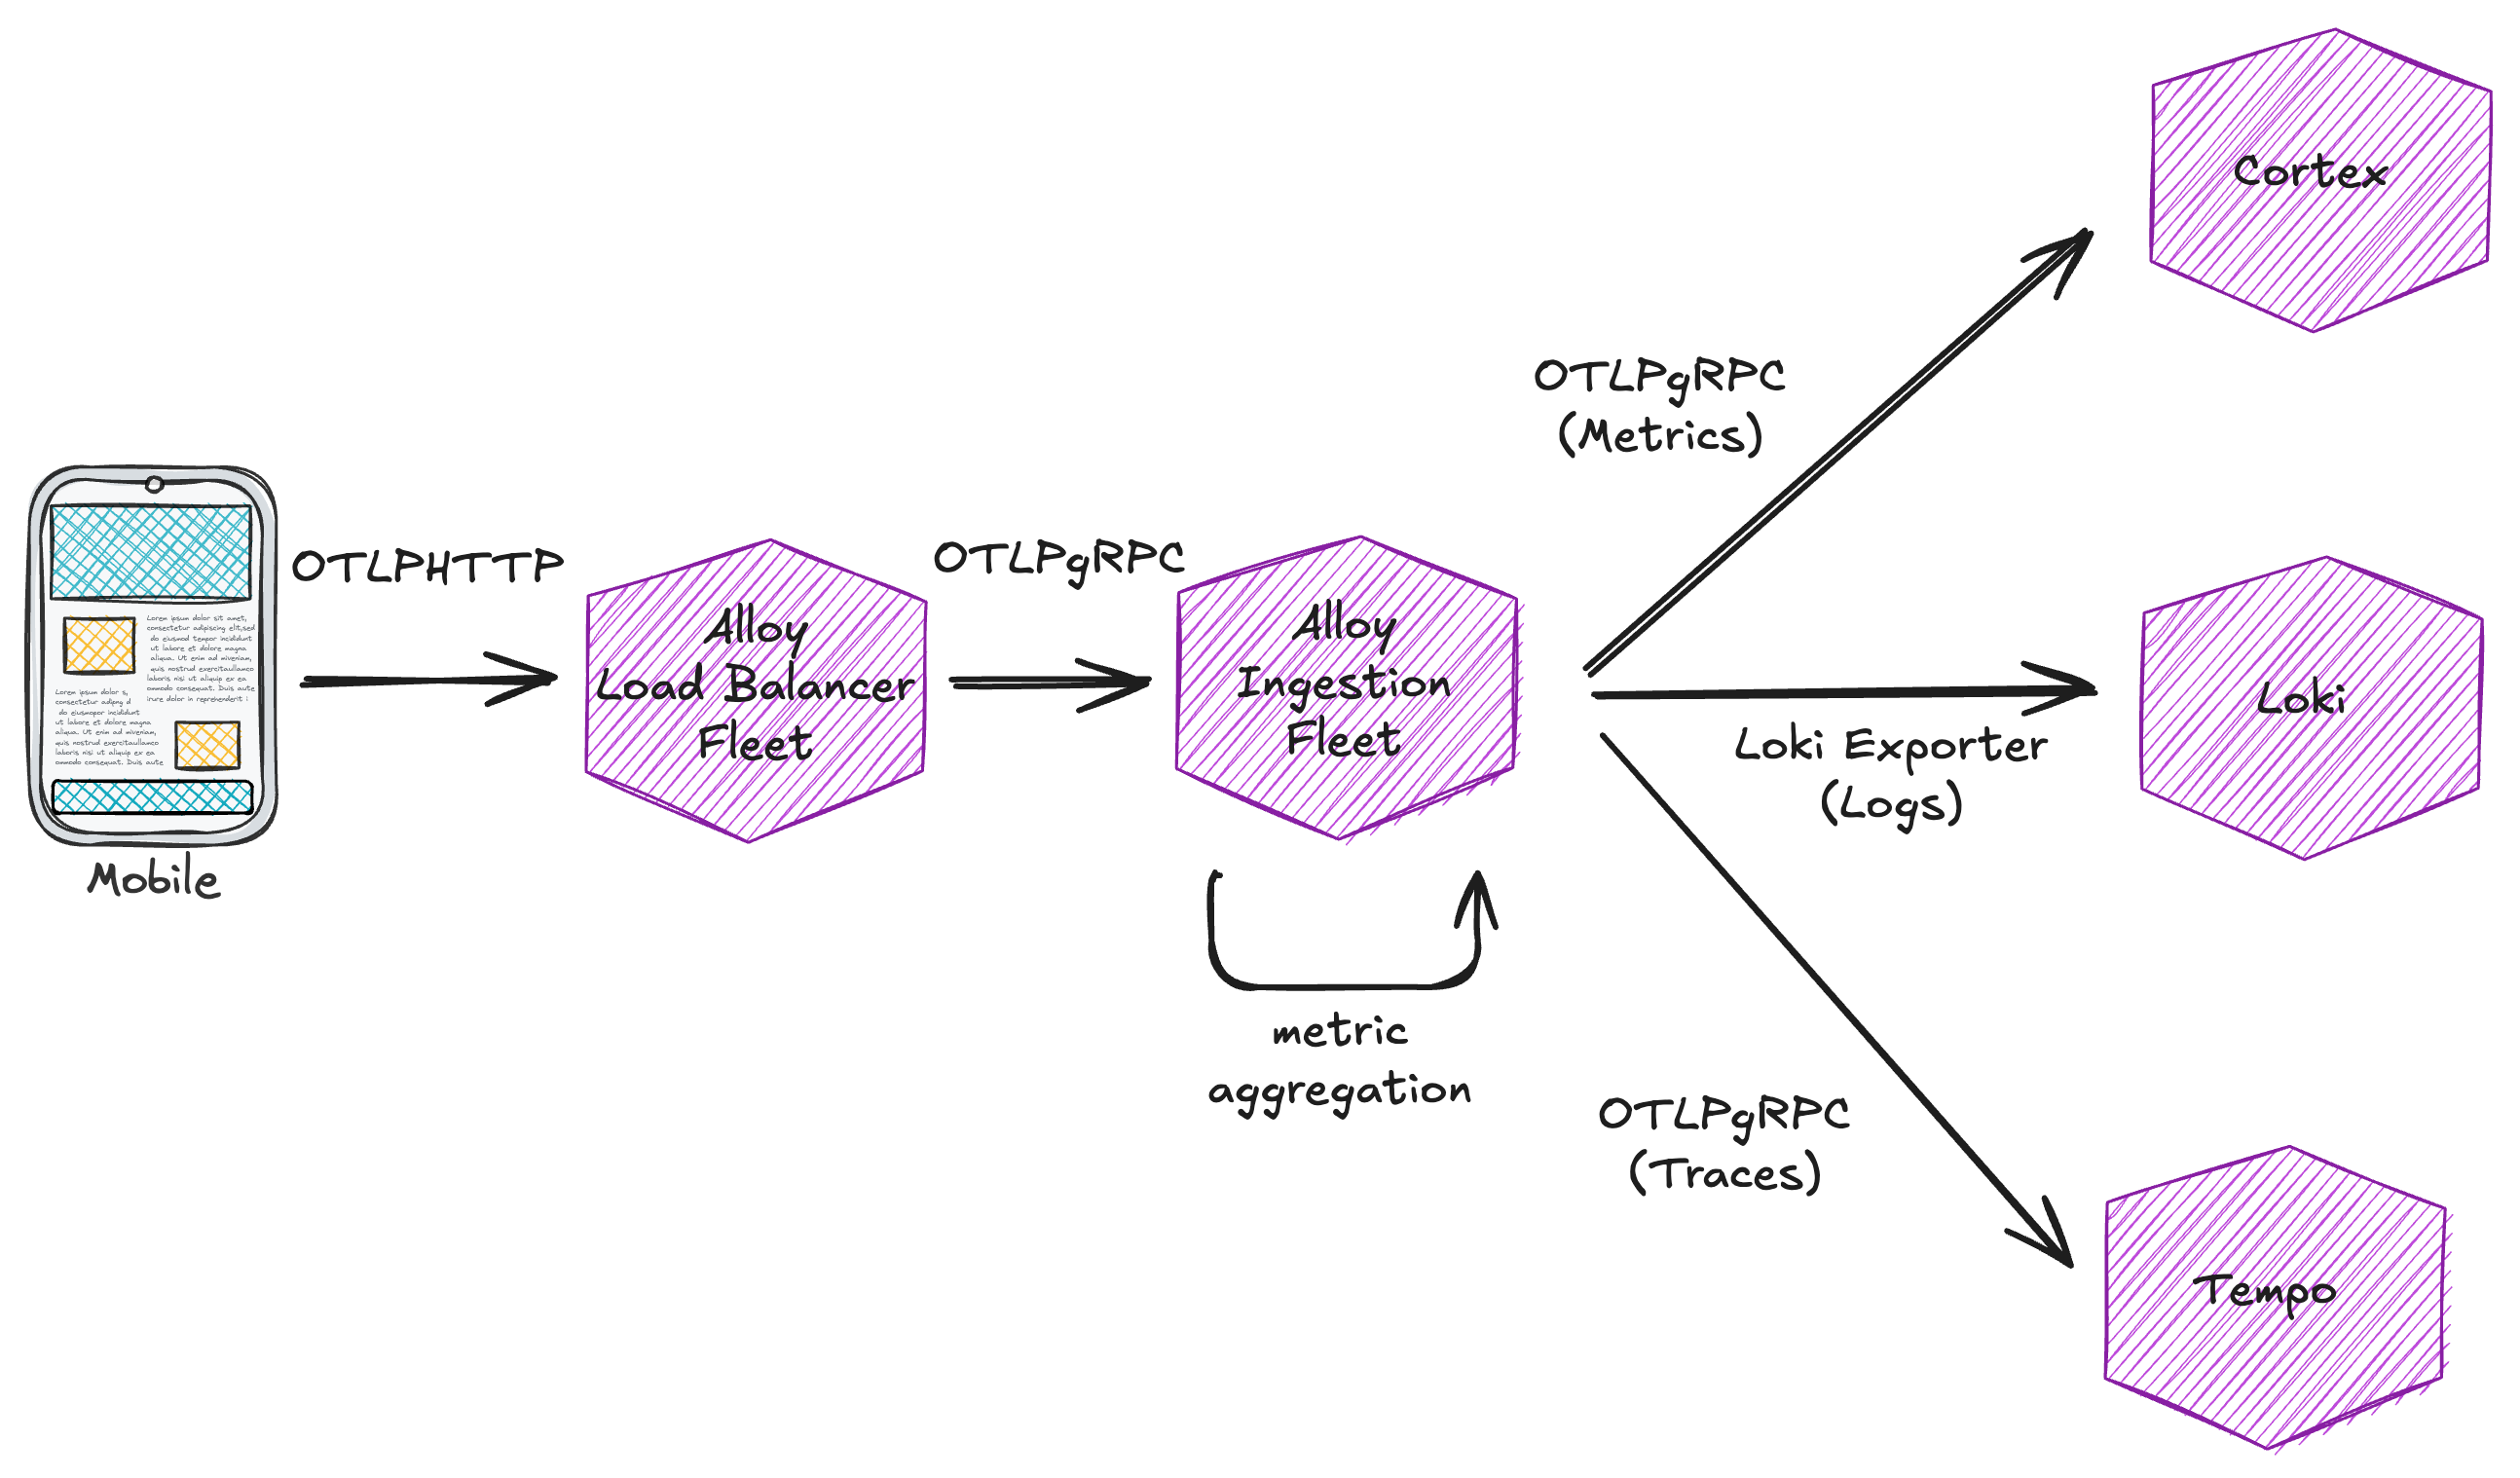
We also addressed the horizontal scaling limitation of our original approach: by using a loadbalancing fleet of alloy instances configured with the streamID key (which is just a hash of all attributes and resources of an incoming metric) to ensure the same combination of metric name and attributes would always land on the same aggregator, we unlocked the ability to horizontally scale the aggregators. Now we could ingest more metrics simply by adding more aggregator pods, with metrics evenly split across them and safely scraped at a constant rate.
Here are a few snapshots of the final setup:

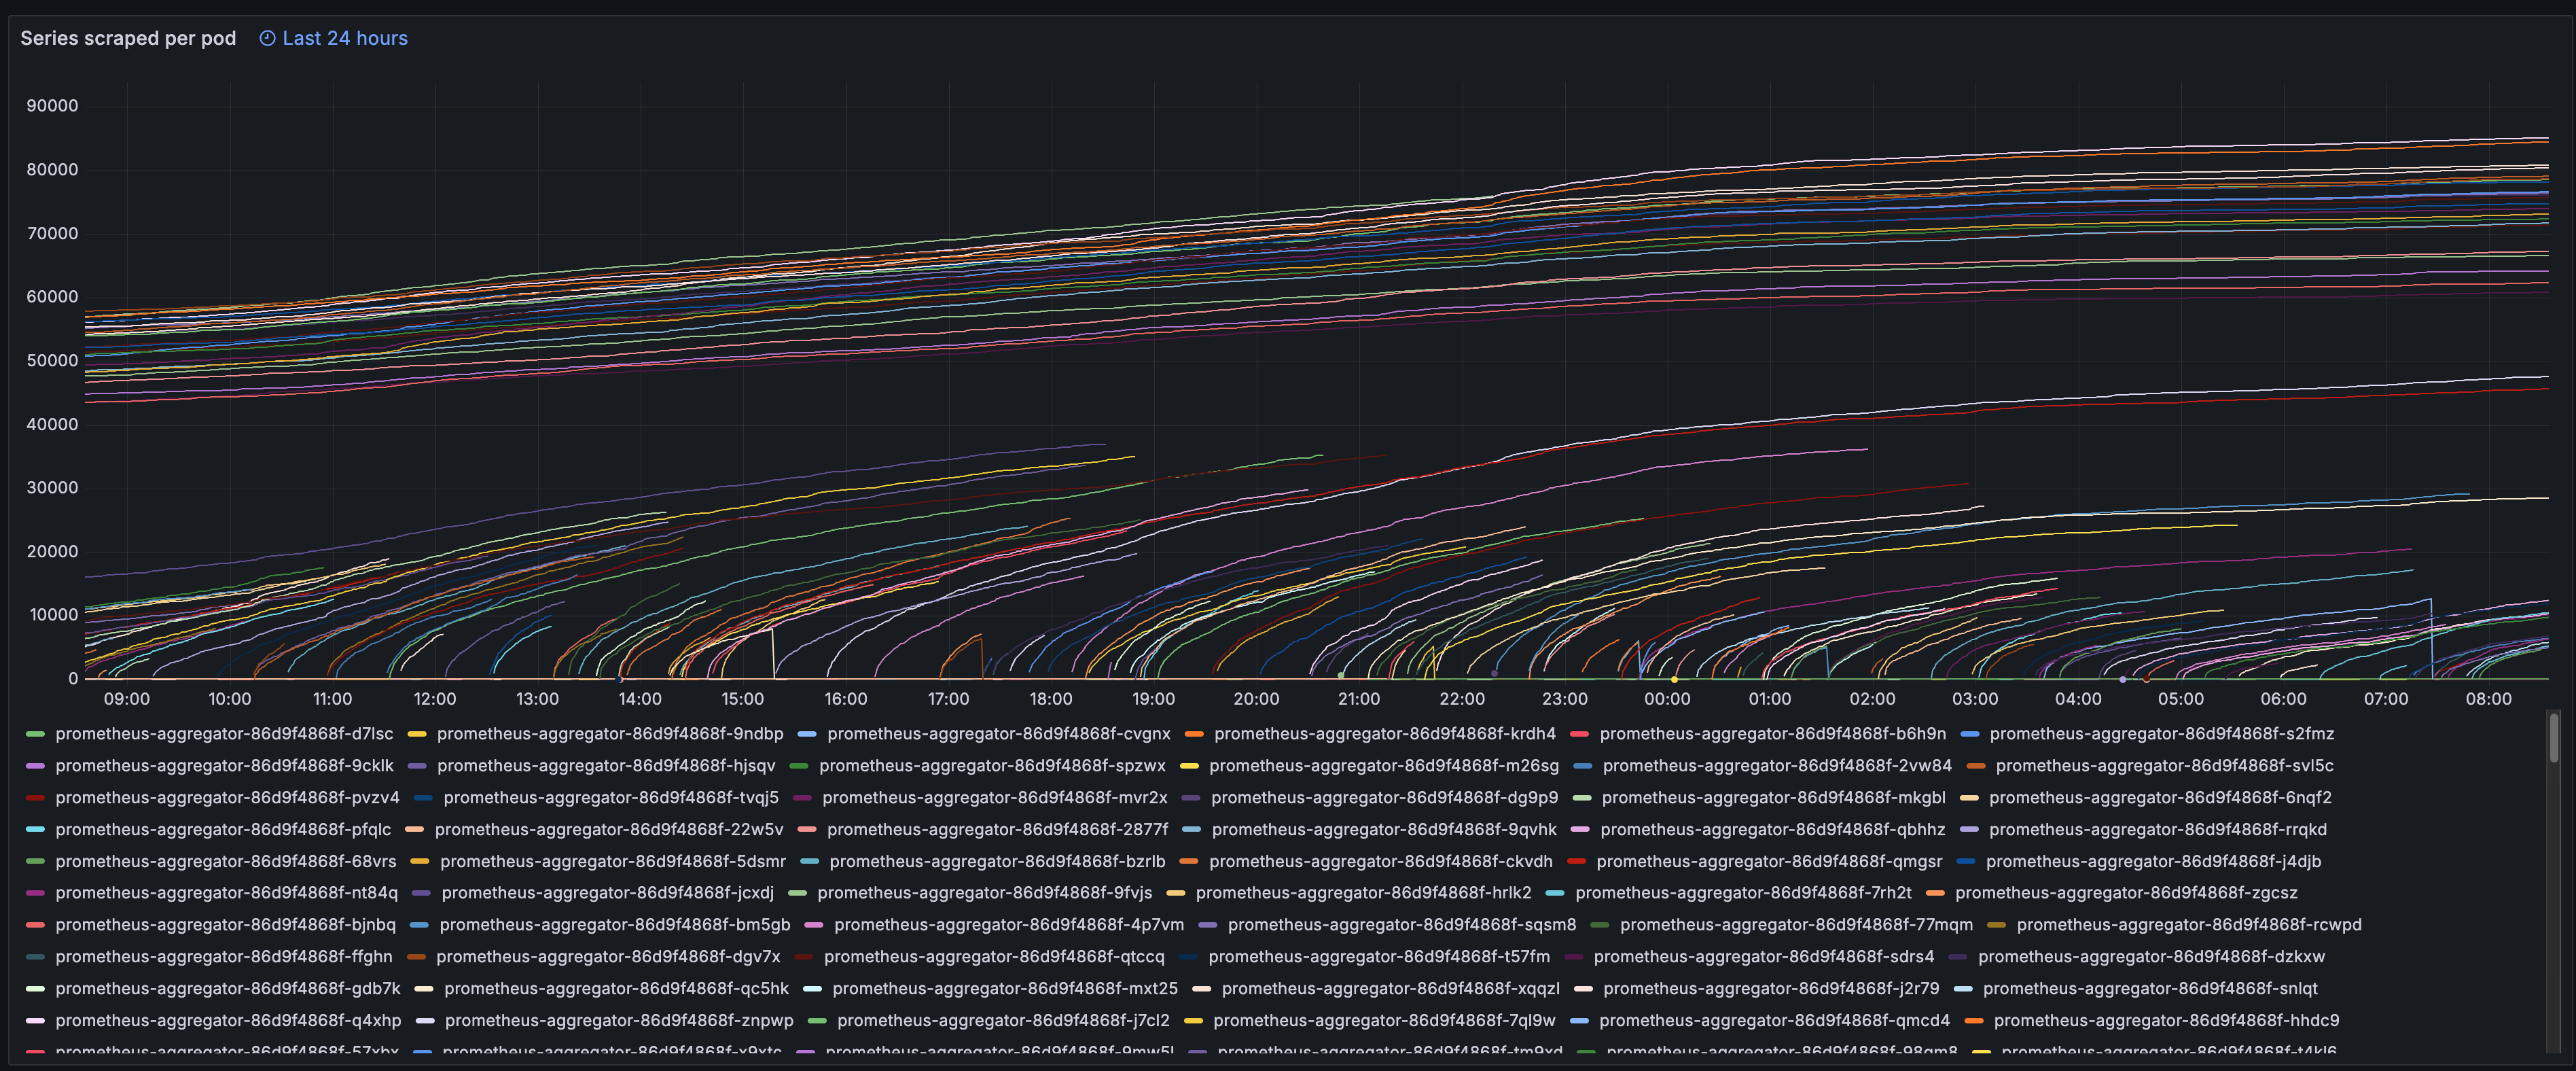
One of the key advantages of adopting OpenTelemetry became evident when we encountered a new problem during adoption: the opentelemetry Android SDK was sending way too many attributes, some with (of course) really, really high cardinality. This is a common issue with mobile observability - the diversity of devices and configurations creates a rich, but potentially overwhelming set of dimensions to measure.
Thanks to the observability built into our custom aggregator, we could quickly identify which metric series were generating the largest combinations of MetricFamilies. From there, we analyzed the cardinality of every single label and found a the problematic ones. For example: we arrived to the conclusion that the device.model.identifier attribute contained extremely detailed information about each phone model (including specific build details) creating thousands of unique series in our metric aggregators.
In our initial implementation without OpenTelemetry, addressing this issue would have required:
Instead, with our OpenTelemetry-based ingestion pipeline in the picture, we were able to:
This flexibility highlights a major benefit of adopting OpenTelemetry on mobile: since changes to mobile apps require new releases and waiting for user updates, having the ability to adjust observability parameters server-side (at ingestion time) is invaluable. It allows us to refine our approach quickly and iteratively without the long feedback loop of mobile app release cycles.
The adoption of OpenTelemetry for mobile apps at Cabify presented some real challenges that required us to develop a deep understanding of the OpenTelemetry ecosystem and overcome several implementation hurdles. Through persistence and iteration, we created a solution that:
This project has given us the opportunity to adopt standards-based libraries that free us from vendor lock-in while simultaneously allowing us visibility from our mobile apps.
Having a unified observability strategy across all our applications enables us to trace issues from the user’s mobile device through our entire backend system, drastically improving our ability to diagnose and resolve incidents. When the next mobile app bug creeps up, we’ll have the observability tools in place to quickly pinpoint the exact source of the issue, allowing us to minimize impact and improve our users’ experience.

Site Realiability Engineer
