Oct 27, 2025
At Cabify, the Help section of our app centralizes all support requests. It’s a critical moment to deliver real assistance and reinforce brand trust. A slow or unresponsive page at this stage can quickly lead to frustration.
With over 1M monthly accesses from our Rider app and 600K from our Driver app, this section serves as the primary support channel for our users. Notably, 85% of these users are located across LATAM, often accessing our Help section while on the move with varying network conditions.
Whether you’re optimizing a desktop web app or a web view inside a mobile app like ours, performance is essential. In this post, we’ll share how we audited and improved load times in our Help section using a data-driven approach, the tools we used, and the key changes that created a faster, smoother user experience.
The Help section in the Cabify app is a separate application shown as a Web View in both Android and iOS apps. You can also access it on Cabify websites like Cabify Business and the Cabify Help Center. This setup ensures a consistent user experience across all platforms while provides the following benefits:
Separating the Help section into its own app presents some challenges. Since it’s part of other apps, we need fast load times. This way, users see it as part of the app, not as a separate or slower experience. We must also keep the JavaScript code compatible across all platforms. While we won’t discuss this in detail, we recommend using @babel/preset-env with Browserlist for easier compatibility setup.
Next, we will explore the user-centric performance metrics we used to understand how users experience our app. We utilized tools such as:
webpack-bundle-analyzer plugin helps us visualize and analyze the bundle contents. Vite is a great alternative, too.Performance optimization begins with how users experience your application. Users may see performance differently based on their network speed and device capabilities.
To tackle this variability, we use measurable performance metrics that show real user experiences. One key metric is Largest Contentful Paint (LCP). It measures how long it takes for the largest visible content element on a page to load.
Google’s Core Web Vitals defines LCP as follows:
“LCP reports the render time of the largest image, text block, or video visible in the viewport, relative to when the user first navigated to the page.”
Google suggests that to ensure a good user experience, sites should aim for an LCP of 2.5 seconds or less. This threshold should be measured at the 75th percentile of page loads for both mobile and desktop devices. This means at least 75% of your users should see an LCP of 2.5 seconds or less.
 Figure 1: LCP thresholds: A good LCP value is 2.5 seconds or less.
Grafana Faro lets us monitor performance in real time. This helped us make a rapid assessment of our optimizations’ impact.
Here’s the measured LCP before optimization:
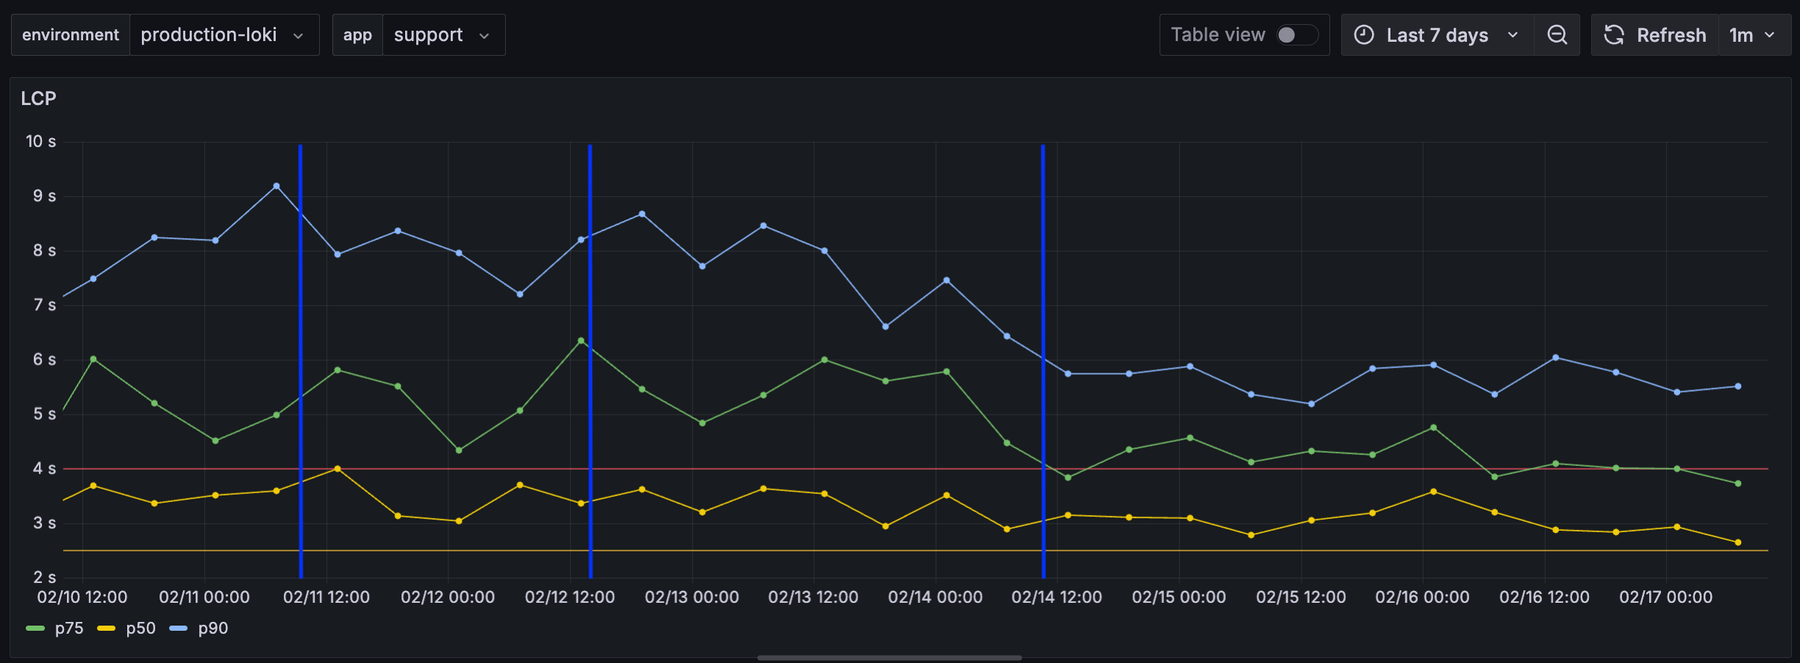
Short-interval LCP data can be noisy. We aggregate and segment it by percentiles to reveal trends and outliers. The next graph shows the LCP distribution before optimization, focusing on the 50th (p50), 75th (p75), and 90th (p90) percentiles:
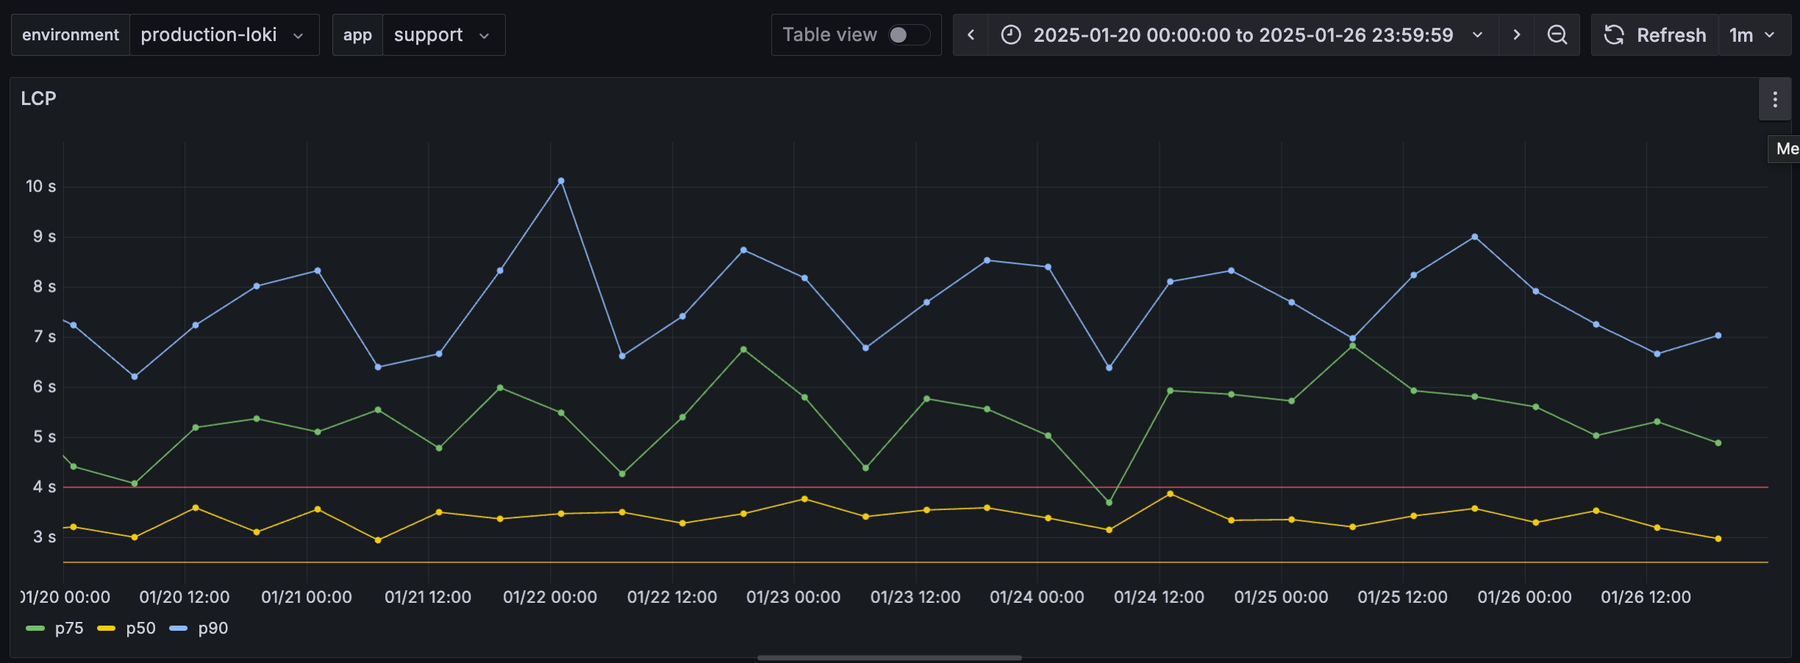
At Cabify, we pay special attention to the 90th percentile (p90) or higher. It highlights the experience of our slowest users, a critical segment when operating at scale.
The gap between p50 and p90 shows the consistency of user experience. A large gap means some users face significant delays, even if the median is acceptable.
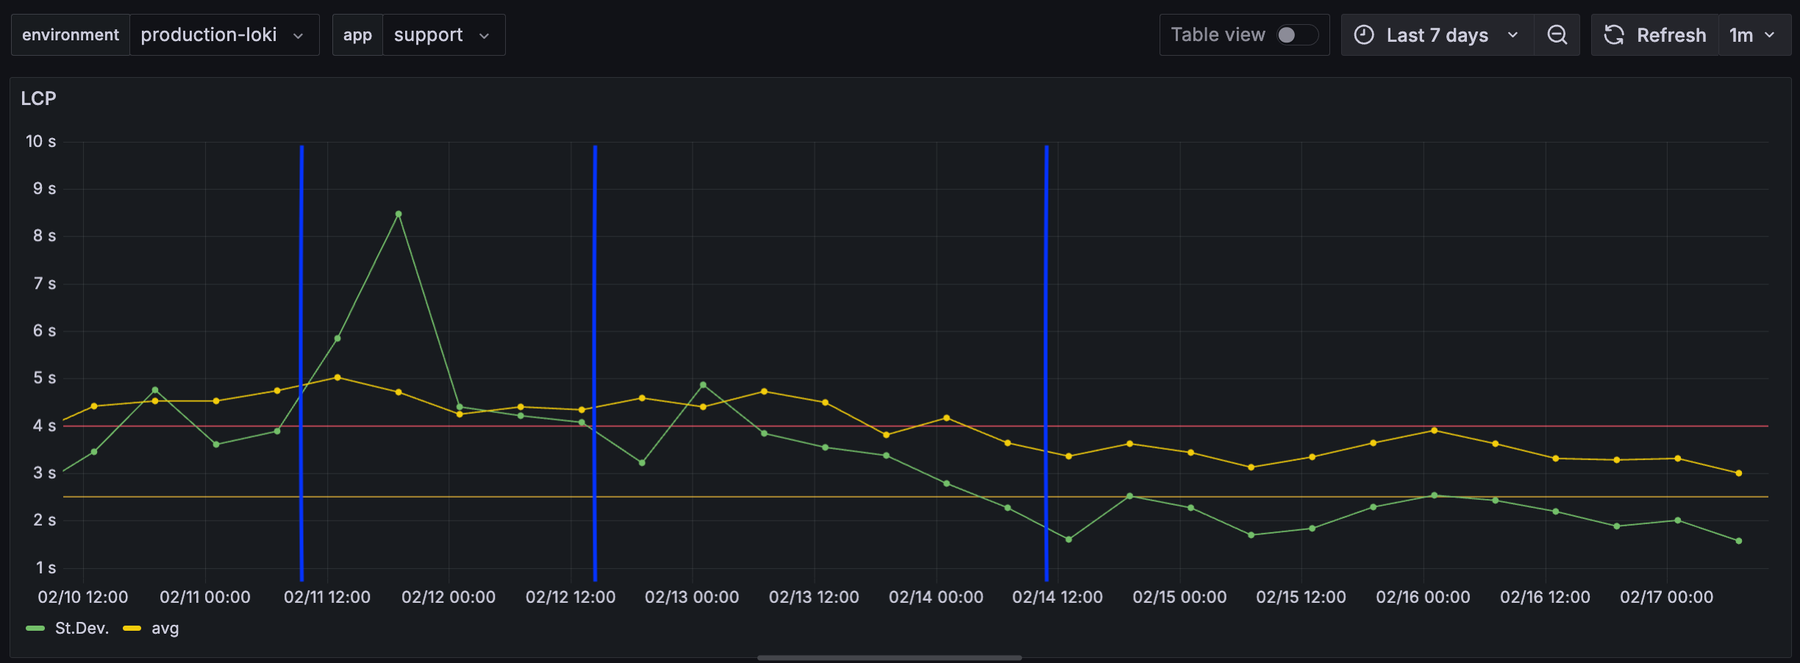
We also track the standard deviation of LCP. A high standard deviation signals a wide gap between the best and worst user experiences. Reducing this variability is key to delivering a consistently fast experience for everyone.
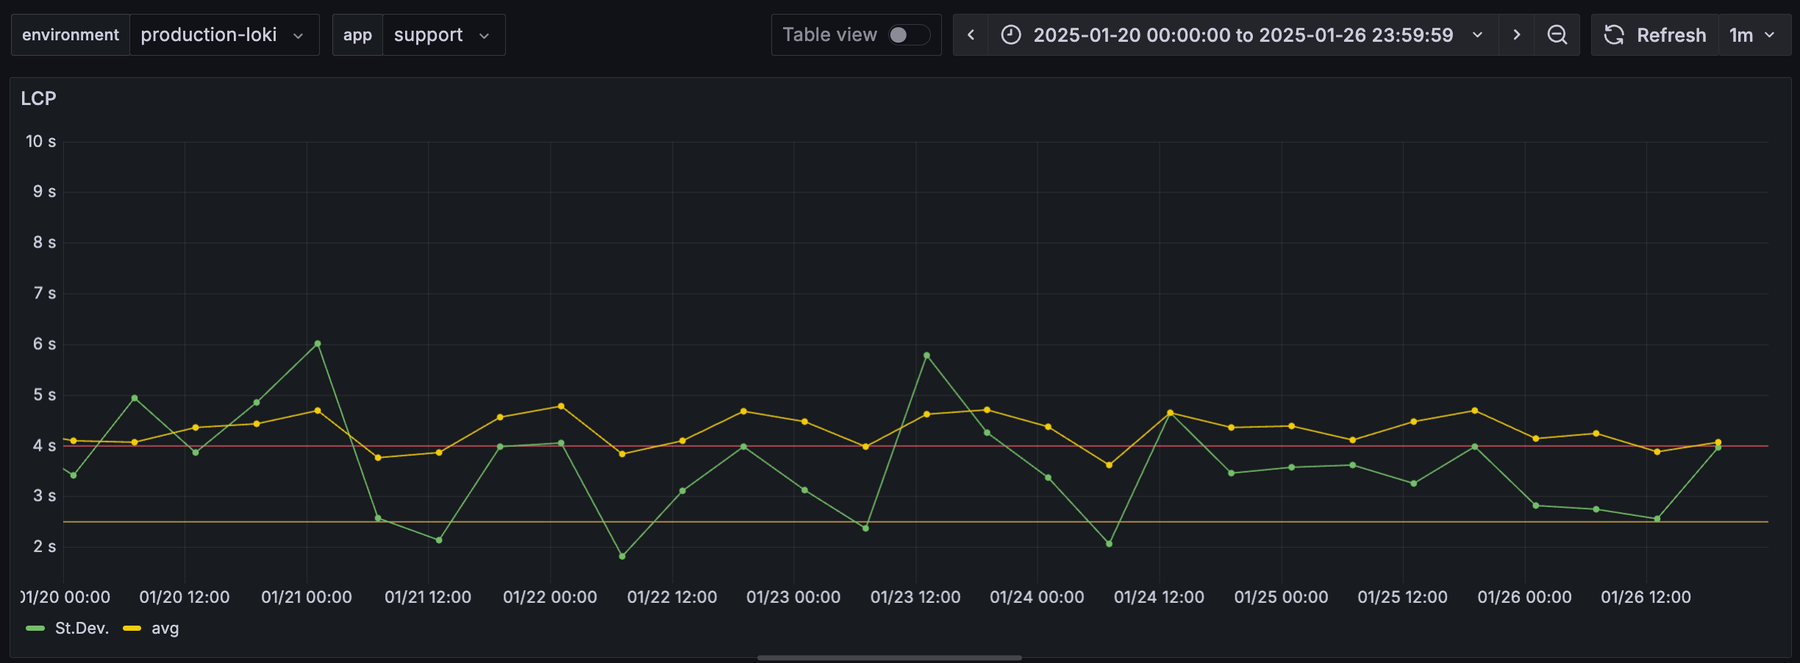
By focusing on p90, the gap to p50, and the standard deviation, we identify and prioritize improvements. This benefits not only the median user but also those at the edges of the experience spectrum.
After we found performance issues in our metrics, we looked for root causes.
Our data reveals that the vast majority of our Help section users (85%) are located in LATAM, accessing support while on the move. These users often experience spotty mobile connections as they travel through urban areas with varying coverage or congested networks. This reality makes performance optimization not just a nice-to-have but a critical business requirement.
Chrome DevTools helps us test various network conditions. It also captures performance metrics. This helps us understand what affects loading times for our users.
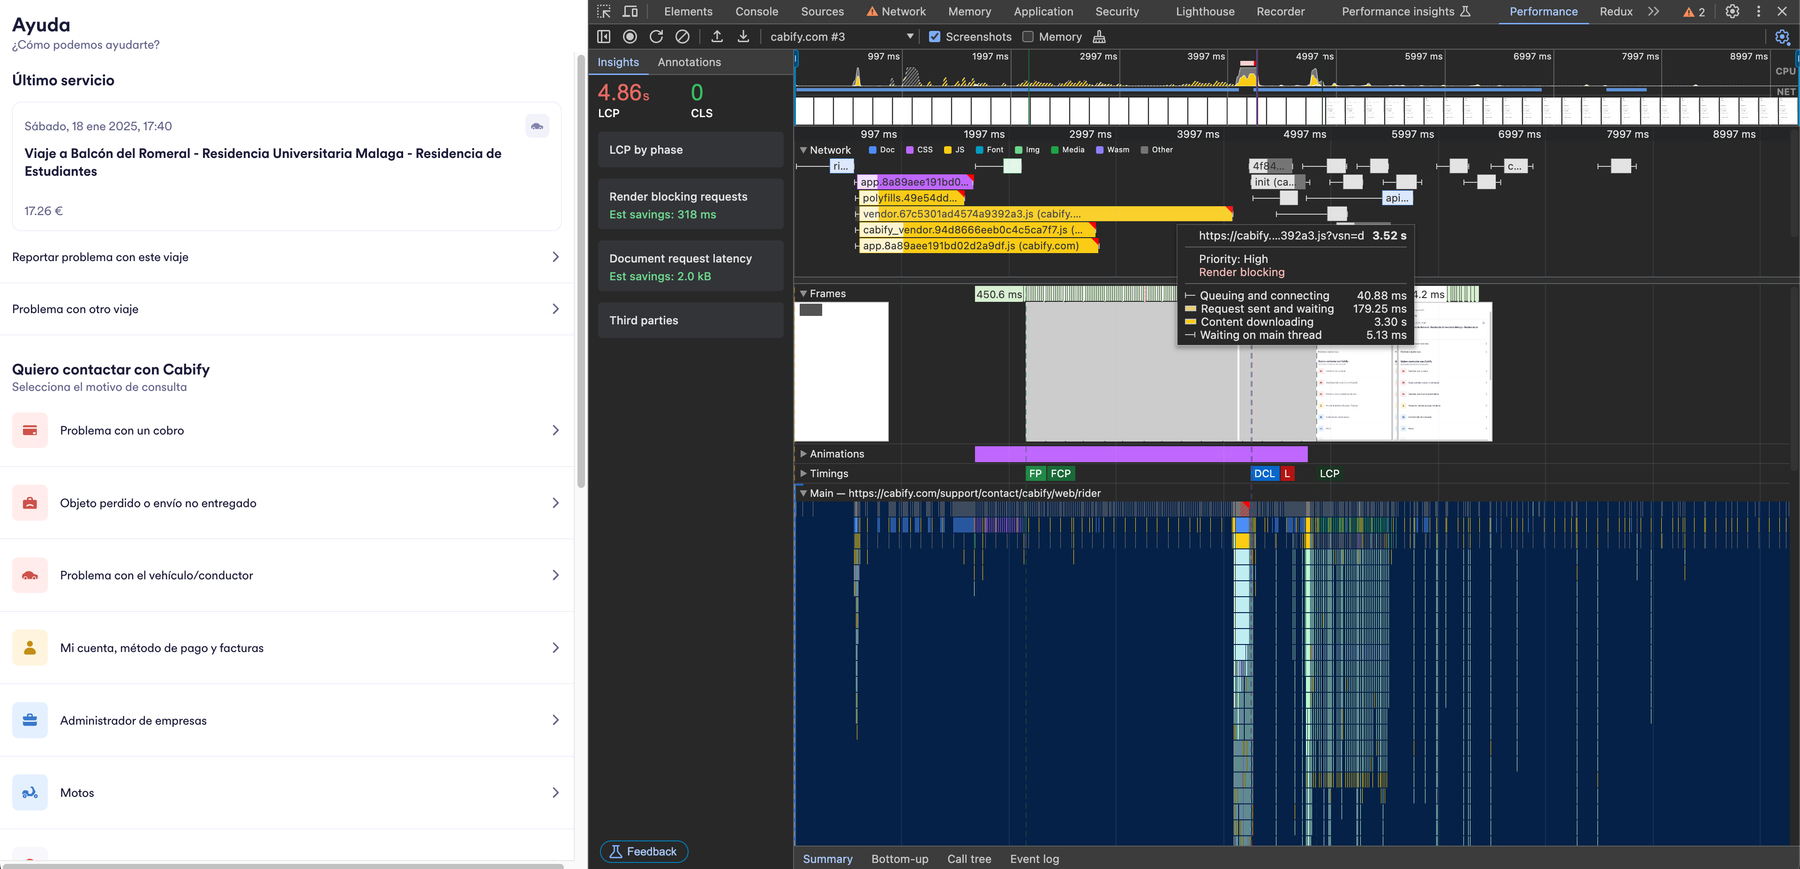
In this snapshot, we see a bottleneck in downloading JavaScript and CSS assets, especially the vendor chunk. This insight gives us a clear target for optimization: we should improve the download of web assets. Now, let’s take action to boost performance!
To optimize the download of resources, we applied several strategies:
As mentioned before, the vendor chunk slows down the entire page render. To cut its size, we can replace large dependencies with smaller ones.
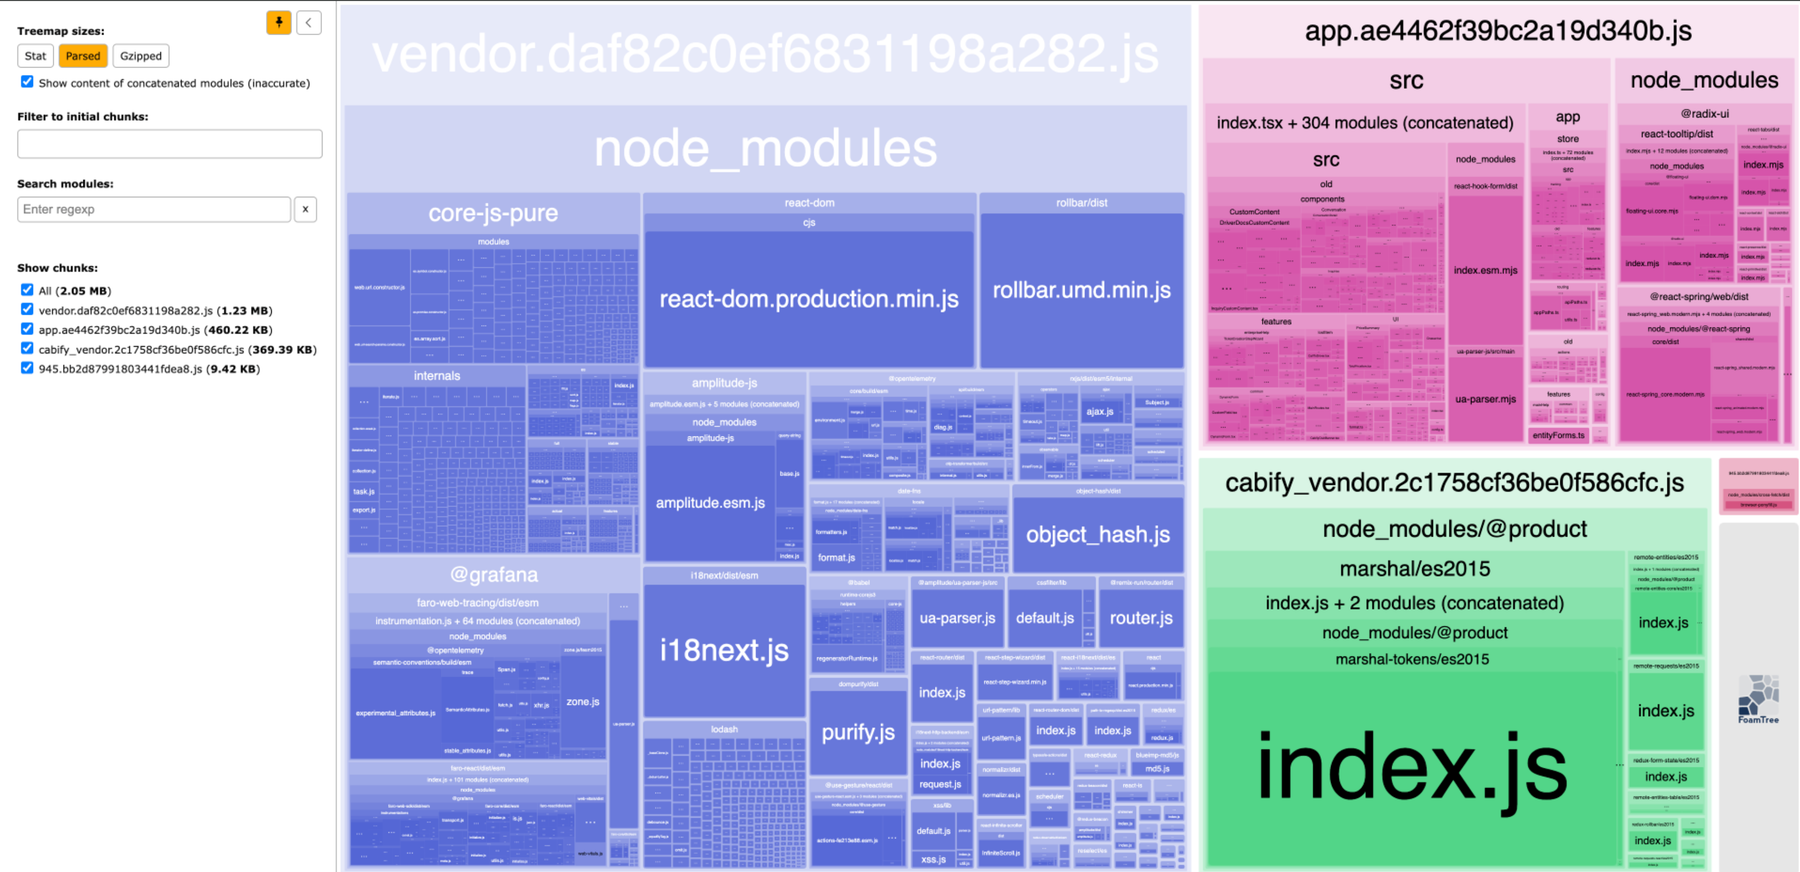
We used webpack-bundle-analyzer to see the size and content of different chunks. This helped us spot which libraries contributed the most to the overall size.
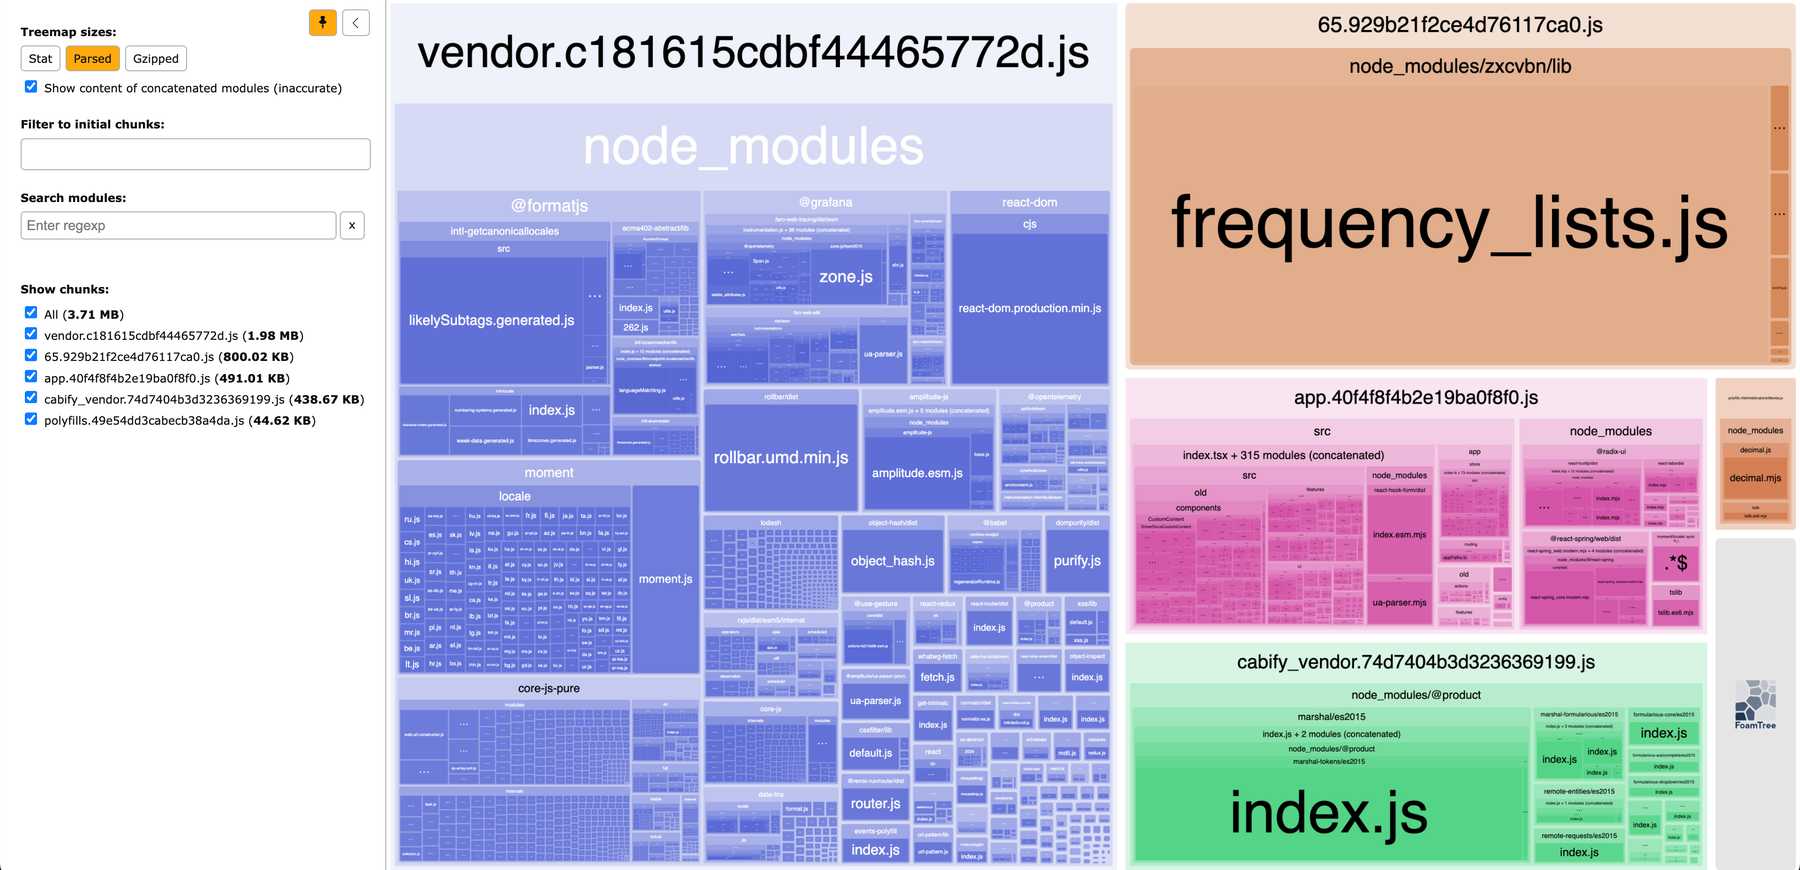
From this analysis, we found several areas for improvement:
We made some changes that cut the total bundle size from 3.71 MB to 2.05 MB. The vendor chunk, which greatly impacts LCP, dropped from 1.98 MB to 1.23 MB. We also removed a large dynamic chunk, 65.929b21f2ce4d76117ca0.js, sized at 800 KB. This change does not affect the initial load.
Parallelization can cut down the time needed to download resources.
Two techniques use parallelization:
These techniques are effective, but they have trade-offs. Splitting a bundle adds extra bytes from headers and metadata needed for reassembly. It’s crucial to measure performance after these changes to ensure loading times improve.
Another point to consider is the increased complexity from these methods. For chunk splitting, we need more configuration. Dynamic loading changes how we declare components, using dynamic import syntax based on the JavaScript library you are using.
In our case, the application needs most dependencies at startup. So, dynamic loading offers no benefits. For chunk splitting, tests showed no significant improvement, even on slower connections. This led us to discard this approach in the end.
At first, compression wasn’t enabled in our setup. We lost it during a package migration (oops! 🙈) and didn’t notice until we checked performance. The key takeaway? Measuring system performance is vital. But we also need alerts to notify us of unexpected changes in metrics. Lesson learned!
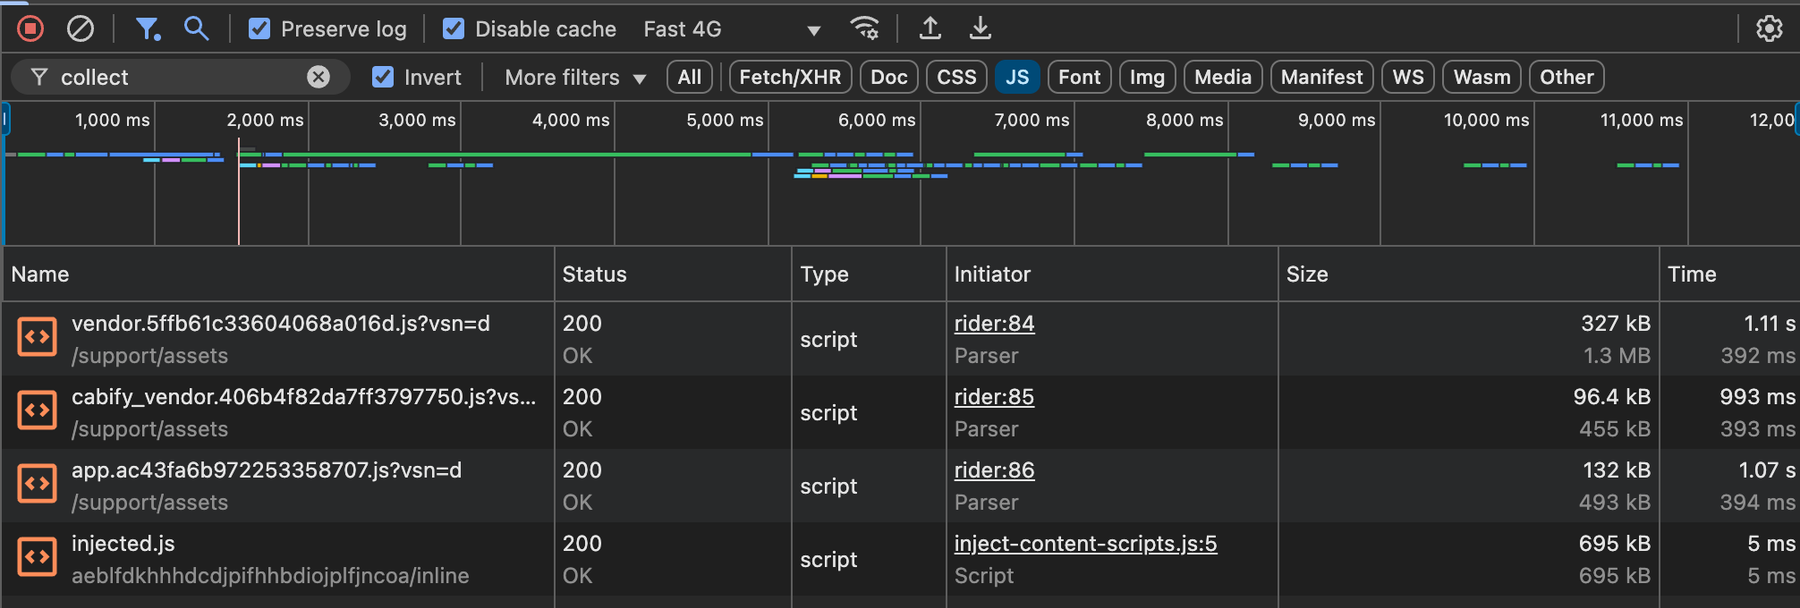
Check if assets are compressed using the Network Tab in Chrome DevTools. In the Size column, you’ll see two numbers: the encoded size (compressed) and the decoded size (uncompressed). If these numbers match, the assets aren’t compressed. The first graph below shows this issue clearly.
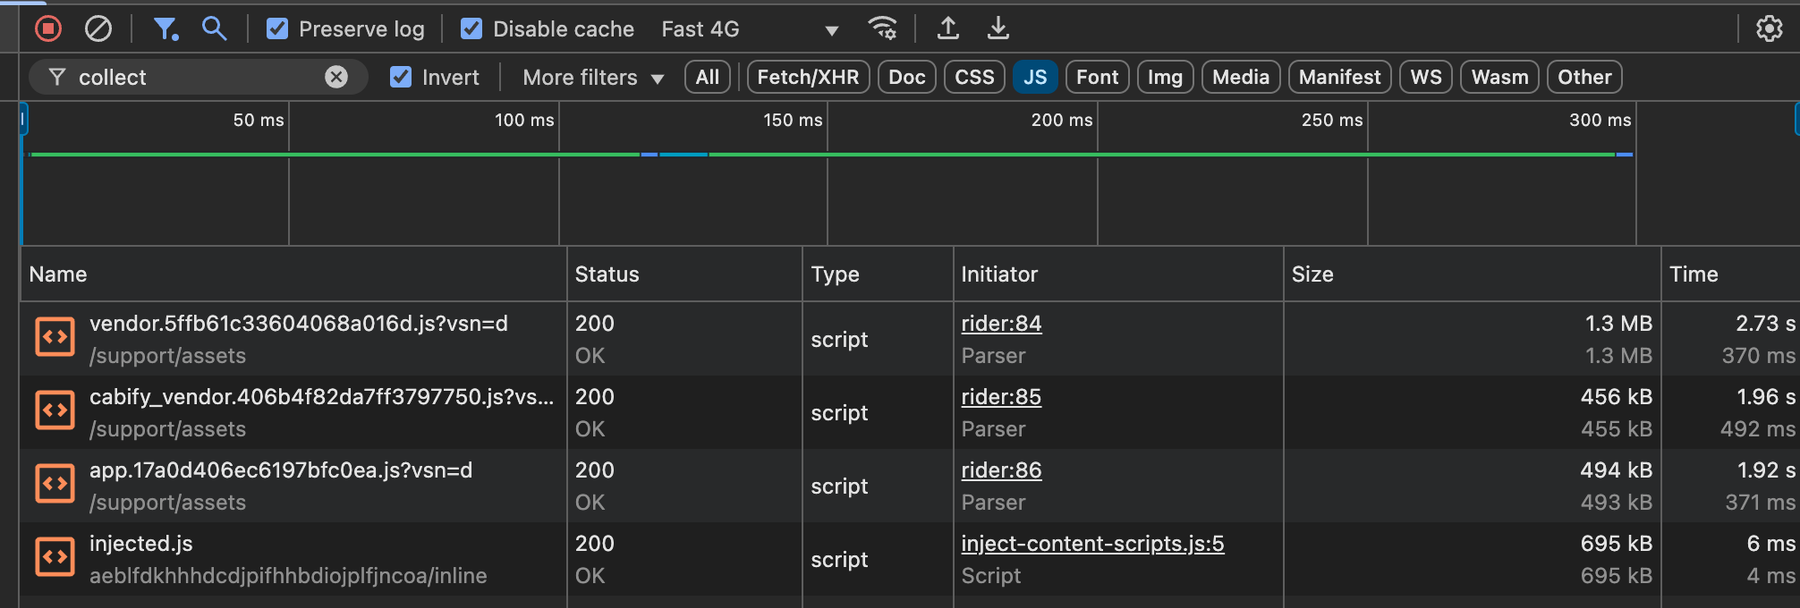
After applying minification, the content shrinks by around 75%.
We configured Brotli as compression algorithm because it offers superior compression rates compared to gzip. Brotli is supported by most modern browsers and can improve compression rates by 15% to 25% for JavaScript, HTML, and CSS files. This results in faster loading times overall, especially for users on slower connections. This setting can be configured using a plugin like compression-webpack-plugin.
Here’s how we configured chunk splitting and minification in our Webpack setup:
// webpack.config.js
  optimization: {
    emitOnErrors: false,
    minimize: true,
    moduleIds: 'named',
    splitChunks: {
      cacheGroups: {
        cabify_vendor: {
          chunks: 'initial',
          name: 'cabify_vendor',
          test: /node_modules\/(@product)(\/\w)*.*\.js$/,
        },
        styles: { chunks: 'all', name: 'app', test: /\.css$/ },
        vendor: {
          chunks: 'initial',
          name: 'vendor',
          test: /node_modules\/(?!(@product)).*\.js$/,
        },
      },
    },
  },
  plugins: [
    new CompressionPlugin({
      algorithm: 'brotliCompress',
      filename: '[path][base].br',
      minRatio: 0.8,
      test: /\.(js|css|html|svg)$/,
      threshold: 1024 * 244,
      compressionOptions: {
        level: 11,
      },
    }),
  ],
After we made the improvements (see the blue lines below), the user experience got better. This was especially true for users with weak connections. Here are the stats:
Here’s a summary of the changes in Largest Contentful Paint (LCP) metrics before and after optimization:
| Metric | Before Optimization (s) | After Optimization (s) | Improvement (%) |
|---|---|---|---|
| p50 (Median) | 3,5 | 3 | 14% 📉 |
| 75th Percentile | 5 | 4,2 | 16% 📉 |
| 90th Percentile | 8,5 | 5,5 | 35% 📉 🔥 |
| Average | 4.5 | 3.5 | 22% 📉 |
| Standard Deviation | 3 - 9 | 2 | 67% 📉 🔥 |
These improvements show how optimizations lower LCP at different percentiles. They also boost performance consistency.
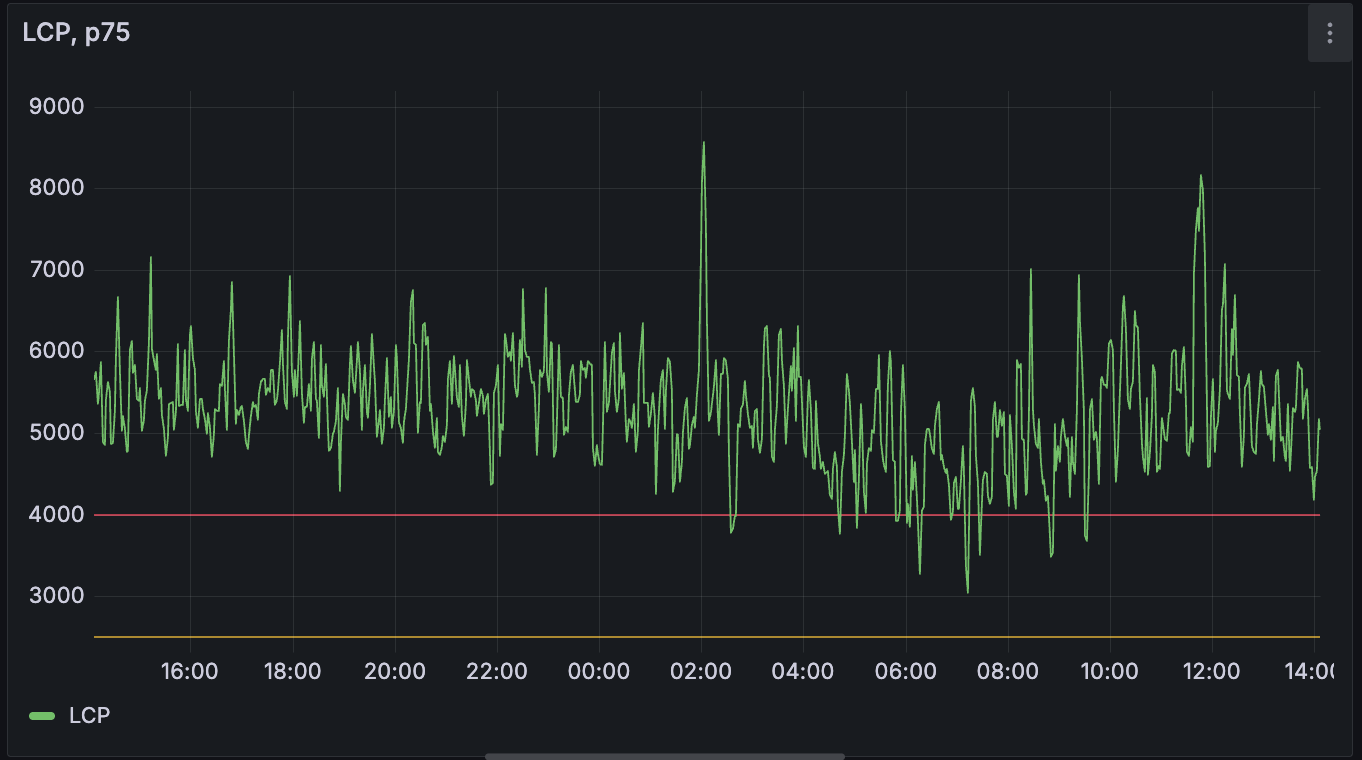
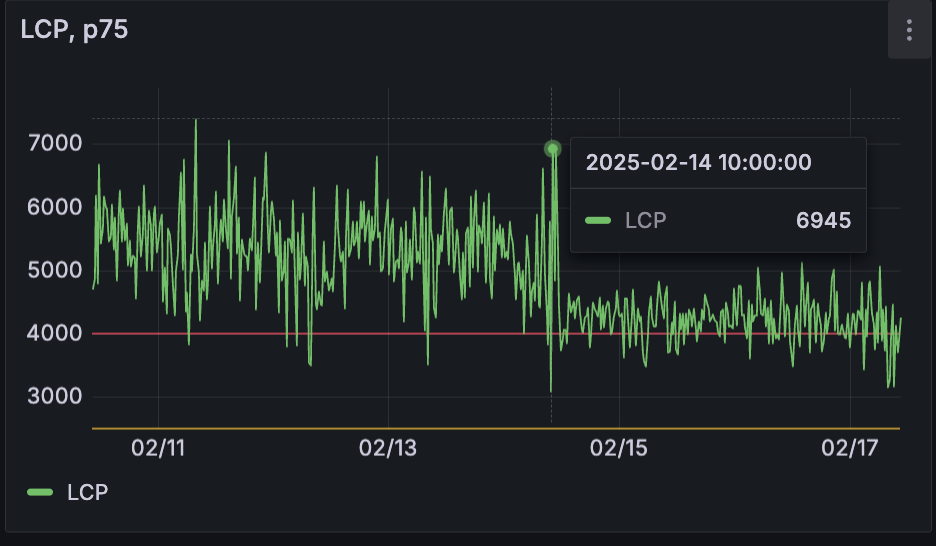
Finally, the next graph shows the improvement in the Grafana Faro LCP chart. This change matches the 75th percentile recommended by Google Web Core Metrics. Sure, the stats shared earlier give a better picture of the gains, but hey, this graph is still pretty cool.
Here are some actions we may consider for the future:
Coverage. It helps identify where tree shaking is ineffective or where we can import functionality dynamically. Removing unused code will reduce asset size, enhancing load times and runtime performance.This article outlines Cabify’s method for improving the performance of a Single Page Application (SPA) in mobile and web apps. Here are the key steps we took in our optimization journey:
By using data, we solved immediate performance issues and set the stage for ongoing improvement. As technology and user needs change, so should our approach. Keep measuring, keep learning, and let data drive your next step!

Senior Software Engineer